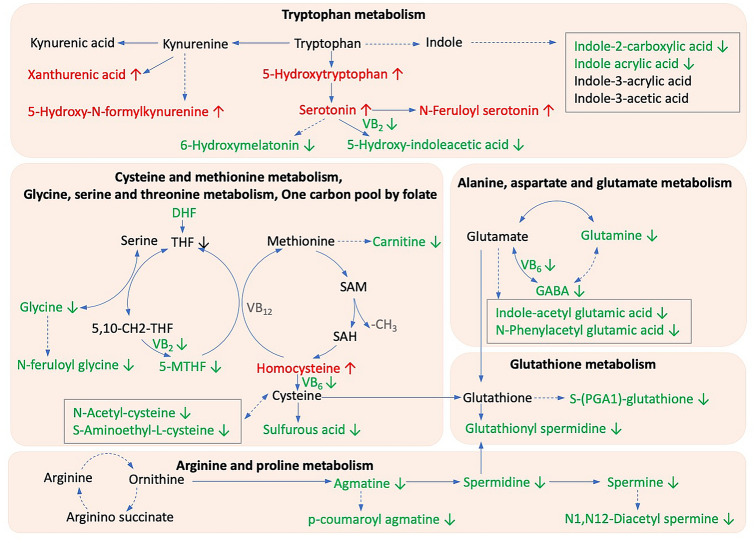
Fig. 2.
Metabolism pathway networks of the differential metabolites between the ASD and TD group. Gut metabolites with a fold change > 1.5, a variable importance in projection score(VIP) > 1, and a FDR-corrected p values < 0.05 for the Student’s t test or Mann–Whitney U test were considered significantly differentially expressed between the two groups. Red font (↑), metabolites increased in the ASD group; Green font (↓), metabolites decreased in the ASD group; black font, no significant difference between the ASD and TD groups; grey font, undetected. DHF, dihydrofolate; 5-MTHF, 5-methyltrahydrofolate; SAM, S-adenosylmethionine; SAH, S-adenosylhomocysteine. ASD autism spectrum disorders; TD typically developing

