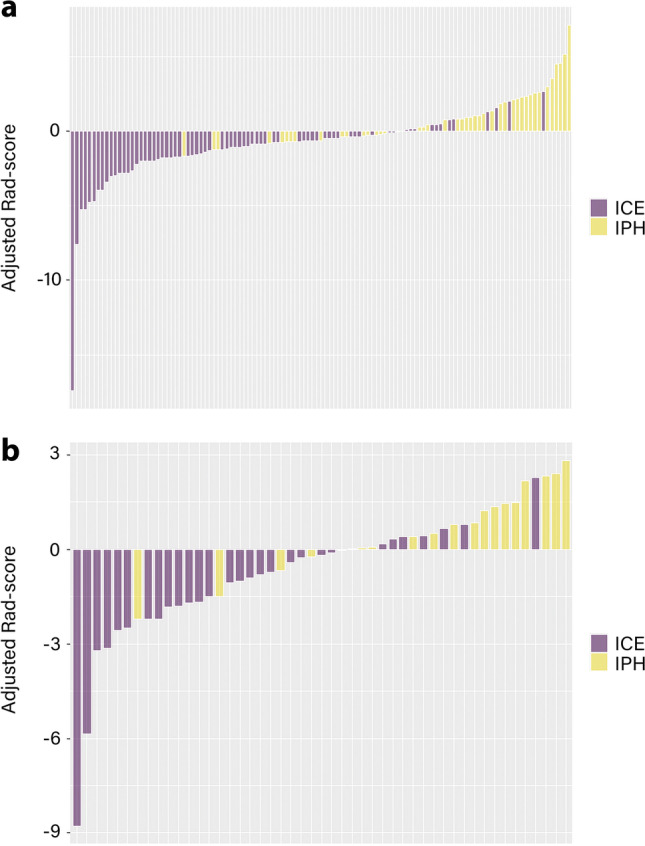
Fig. 4.

Waterfall plots of the radiomic signature. The waterfall plot shows the distribution of the adjusted Rad-scores and diagnoses of each patient in the training cohort (a) and the validation cohort (b). The default is set to IPH (the yellow bar) above the baseline and ICE (the purple bar) below the baseline. This plot depicts the association between the predicted and actual diagnoses in which mismatching of the colour coding indicates misclassification by the Rad-score. Rad-score minus the cutoff value is the adjusted Rad-score. ICE iodinated contrast extravasation, IPH intraparenchymal haemorrhage, Rad-score radiomics score
