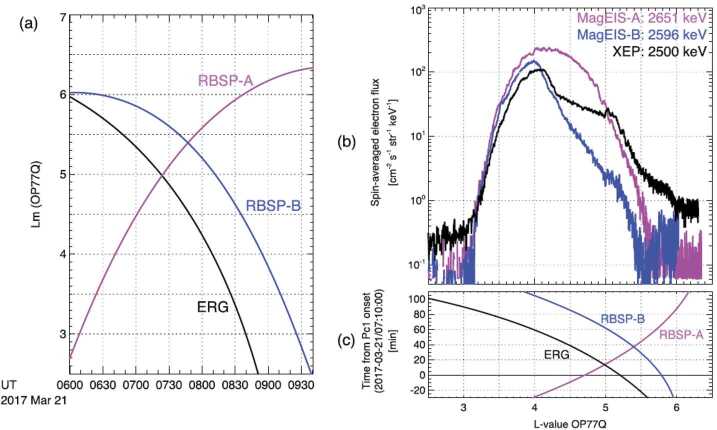
Fig. 11.
(a) Location of Van Allen Probe-A (magenta), Van Allen Probe-B (blue), and Arase (black) around the time of interest. (b) Spin-averaged fluxes of ∼2.5-MeV electrons observed by Van Allen Probe-A/MagEIS (magenta), Van Allen Probe-B/MagEIS (blue), and Arase/XEP (black) as a function of -value. (c) Time after the Pc1 wave onset at ATH (0710 UT on 21 March) as a function of location of Van Allen Probe-A (magenta), Van Allen Probe-B (blue), and Arase (black) in . The -shell of this figure is the McIlwain -shell derived from Olson and Pfitzer 1977 (Olson and Pfitzer 1977) model (Kurita et al. 2018)

