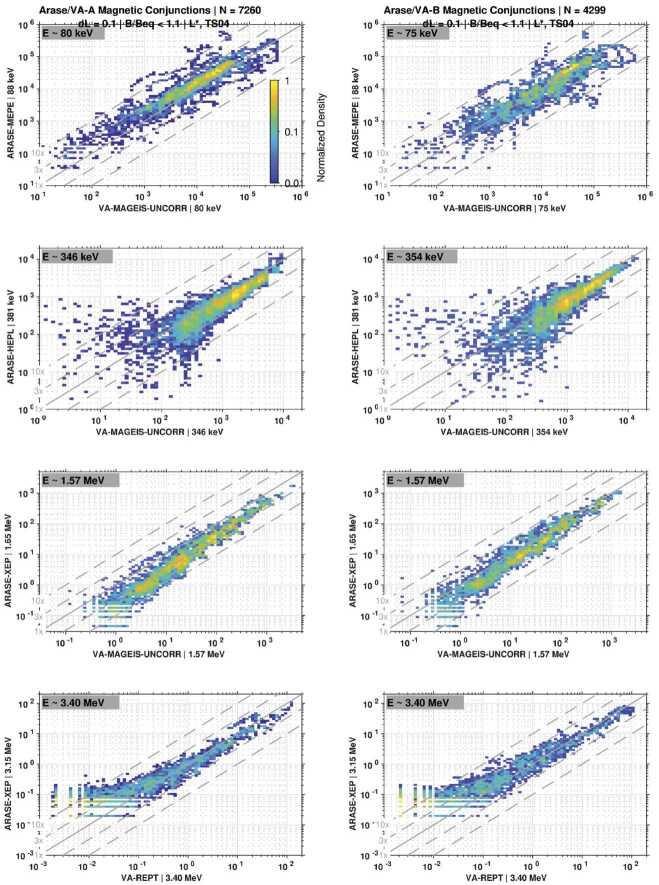
Fig. 15.
Scatter plot comparisons of electron flux for similar energy channels on Arase and Van Allen Probe A (left column) and B (right column) during magnetic conjunctions. Each panel shows Van Allen Probe flux on the horizontal scale and Arase flux on the vertical. All flux units are (cm2 s sr keV)−1. Guidelines are shown indicating factors of 1x, 3x, and 10x. The color scale is normalized to the maximum occurrence frequency over all flux bins

