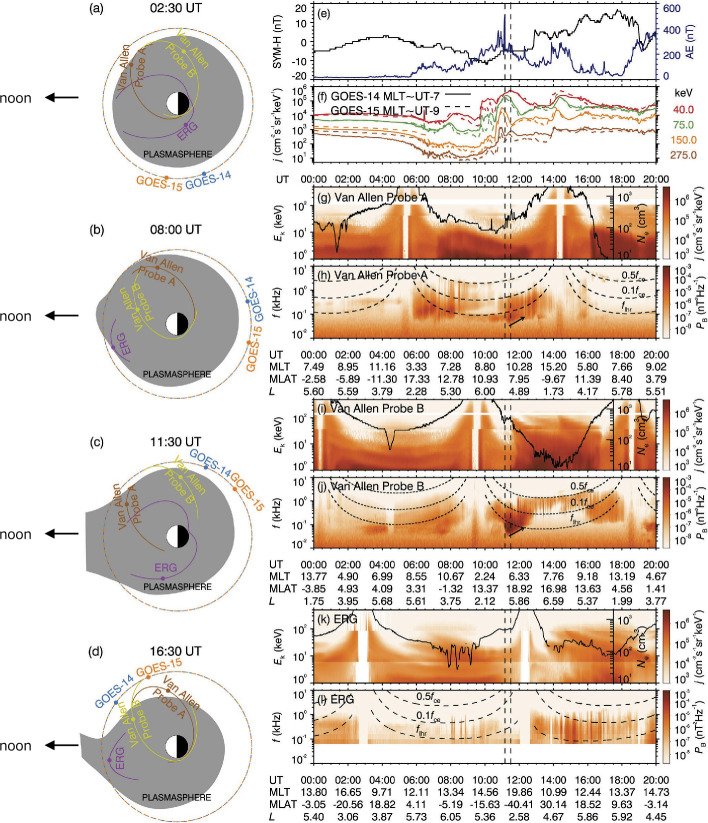
Fig. 7.
(a–d) Overview of the 13 January 2018 plasmaspheric hiss event. Schematic diagrams of plasmasphere structures (shadows) and spacecraft locations (colored dots) at 02:30, 08:00, 11:30, and 16:40 UT, respectively. The plasmasphere shadows are illustrative cartoons based on the density profiles of the Van Allen Probes and Arase missions, whose trajectories (solid lines) covered the period 00:00–05:30, 05:30–10:00, 10:00–14:00, and 14:00–20:00 UT in a–d, respectively. (e) Geomagnetic activity indices SYM-H and AE. (f) Hot electron differential flux profiles. (g, i, k) Hot electron differential energy spectra, with overplotted local electron densities. (h, j, l) Wave magnetic power spectra, with the overplotted frequencies 0.5 fce (equatorial electron cyclotron frequency), 0.1 fce, and fLHR (equatorial lower hybrid resonance frequency). The vertical dashed lines mark the sudden enhancement of hiss waves and the substorm injection front observed by Van Allen Probe B, respectively. The blank region represents the data gap (Liu et al. 2020)

