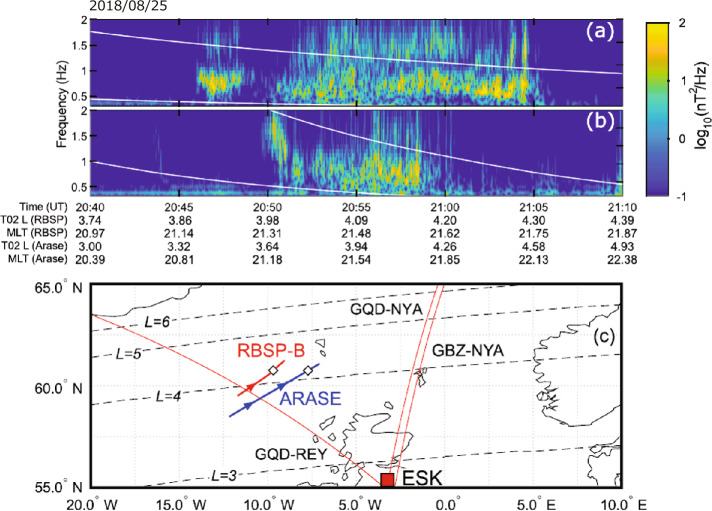
Fig. 8.
(a) Spectrogram of the RBSP-B perpendicular wave power (field-aligned coordinates), with the helium and oxygen gyrofrequencies plotted in white, on August 25, 2018. (b) Same as (a) but for the data from Arase’s MGF instrument. (c) Map of the event region with the RBSP-B and Arase T02 footprints in red and blue, respectively (arrows indicate the direction of travel, while white diamonds indicate the point of the closest approach); three AARDDVARK VLF paths in red; and the Eskdalemuir search-coil magnetometer in a red square. -shells from 3–6 are shown as dashed black lines (Hendry et al. 2020)

