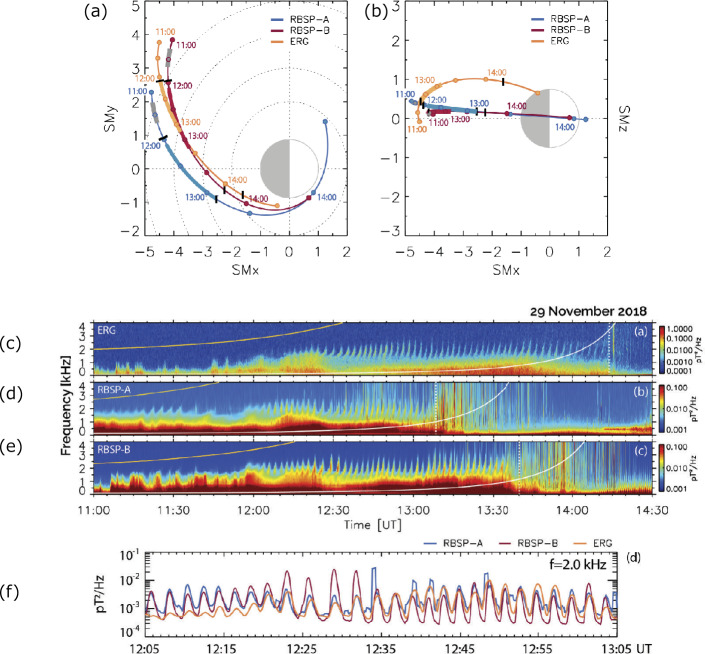
Fig. 9.
(a)(b) Position of Arase (orange) and Van Allen Probes A (blue) and B (red) from 11:00 to 14:30 UT on November 29, 2018, in solar magnetic coordinates. Solid colors represent the trajectory of the satellites with overlapped solid gray lines indicating the first and main conjugated events. Each dot represents 30 min. Vertical black solid bars indicate timings where each satellite observed QP emissions starting at 12:06 UT. (c) (d) (e) Power spectral density for Arase and Van Allen Probes A and B between 11:00 and 14:00 UT (0–4 kHz). The bottom panel shows (f) the intensity variations (smoothed with a 30 s window) as a function of time for kHz for Arase (orange) and Van Allen Probes A (blue) and B (red) (Martinez-Calderon et al. 2020)

