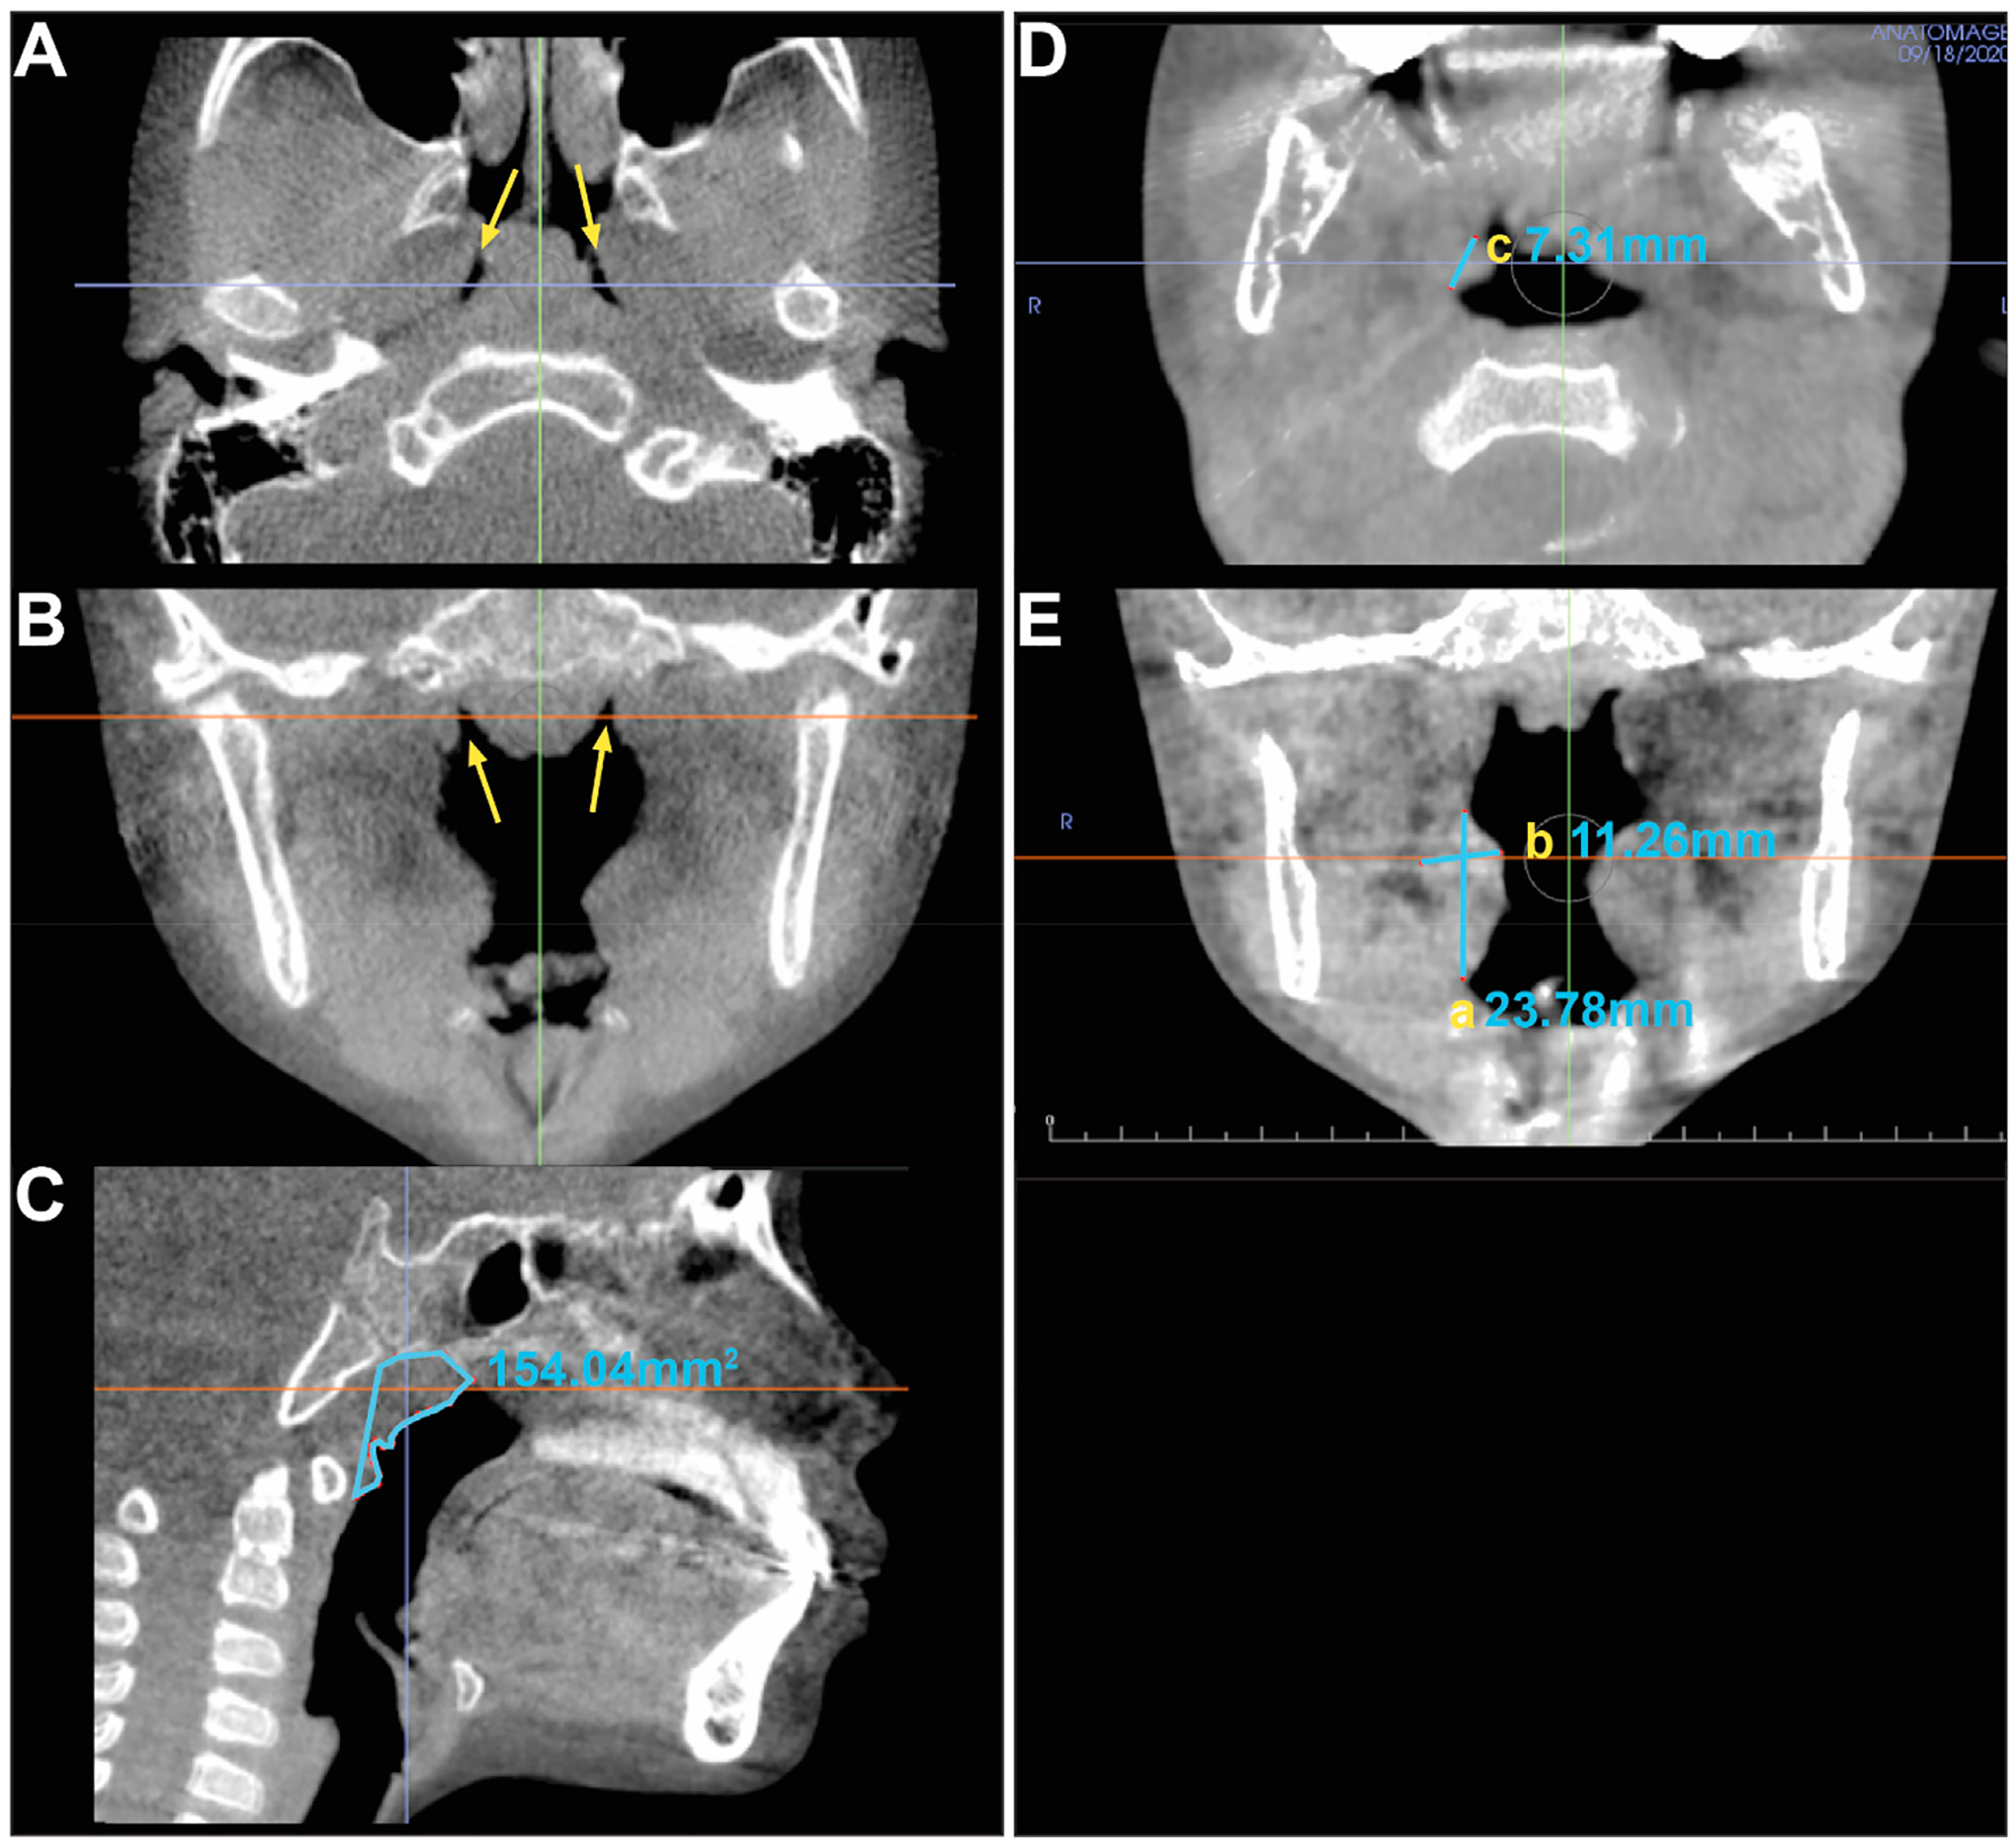
Fig. 1.

CBCT slices illustrating the methodology for volumetric measurement of the adenoids and of the palatine tonsils. For adenoid measurements, the Fossae of Rosenmüller in the axial (A) and coronal (B) slices at the arrows mark the lateral limit of the measurements. The sagittal slice (C) at midsagittal plane shows the outlined area of the surface area measurement of the adenoid. For palatine tonsil measurements, the axial slice (D) illustrates the depth (c) of the right tonsil and the coronal slice (E) illustrates the vertical (a) and transverse measurements (b) of the right palatine tonsil.
