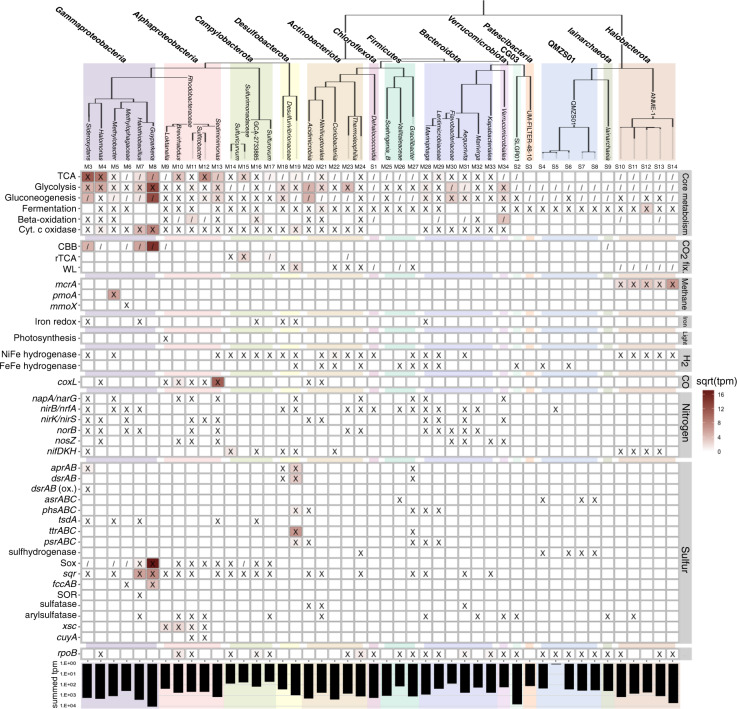
Fig. 3. Metabolic potential and gene expression in high-quality MAGs and medium-quality SAGs.
The identification number for each genome is noted above each column. An ‘X’ indicates the presence of a gene or pathway within the genome; ‘/’ indicates a partial pathway. A complete list of gene IDs and criteria used for denoting the presence of a complete or partial pathway is found in Tables S12 and S13. The square root of transcripts per million reads (tpm) of metatranscriptome reads mapped to the genome is indicated by a color scale within each square. The summed tpm indicates the total tpm of reads mapped to the genome on a logarithmic scale. A corresponding table for medium-quality MAGs is located in Table S8.

