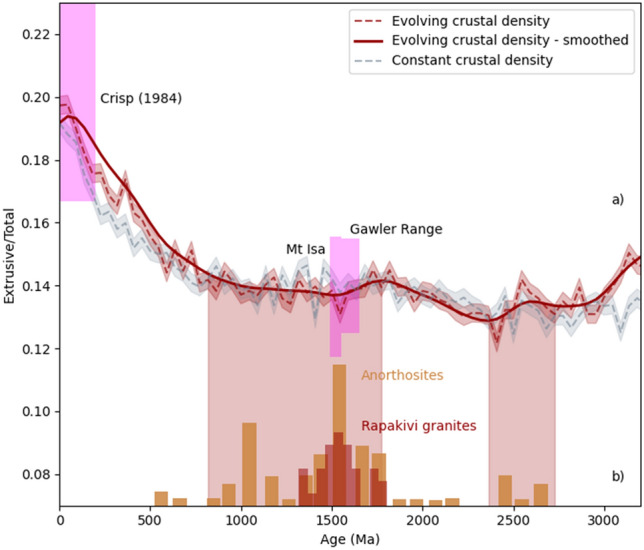
Figure 5.

(a) Evolution of extrusive to total magmatism through time (E/T ratio), calculated for an evolving crustal profile (red) and for the case where the crustal density profile does not change (a constant Proterozoic profile) and only the mantle-derived melt densities change with time (teal). The latter isolates the effects of mantle-temperatures alone. Uncertainties are shown by shading, and a polynomial fit by the dark line, indicating two minima at ca 800–1800 Ma, and ca. 2300–2700 Ma. (b) Distribution of anorthosites15 and Rapakivi granites49 peaking in the Mesoproterozoic, similar to a low in the E/T ratio. A minimum in the E/T ratio occurs across the Proterozoic–Archaean boundary corresponding to the limited number of late-Archaean/early Proterozoic massif-type anorthosites. Magenta regions show the E/T ratio for intraplate volcanic systems from White et al.29 on the left, and those calculated here for the Gawler Range Volcanics and Mt Isa based on geophysical modelling.
