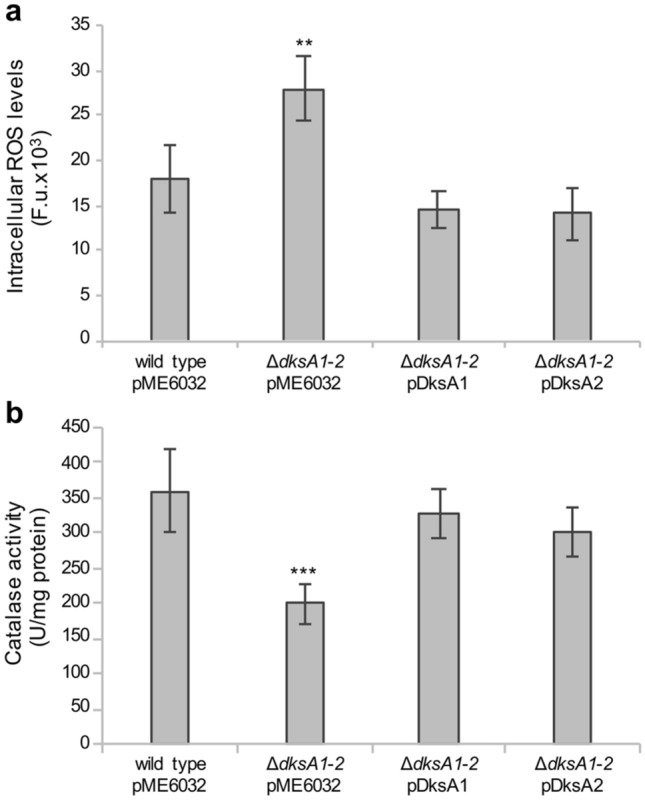
Figure 4.

Effect of dksA1 and dksA2 on endogenous ROS levels and catalase activity. Intracellular levels of ROS (expressed as Fluorescence Units, F. u.) (a) and catalase activity (b) were determined in the indicated strains grown to the late exponential phase (OD600 ≈ 2.5) in LB supplemented with 0.1 mM IPTG. The average values from three independent experiments are reported with standard deviations. **p < 0.01, ***p < 0.001 versus wild type (ANOVA).
