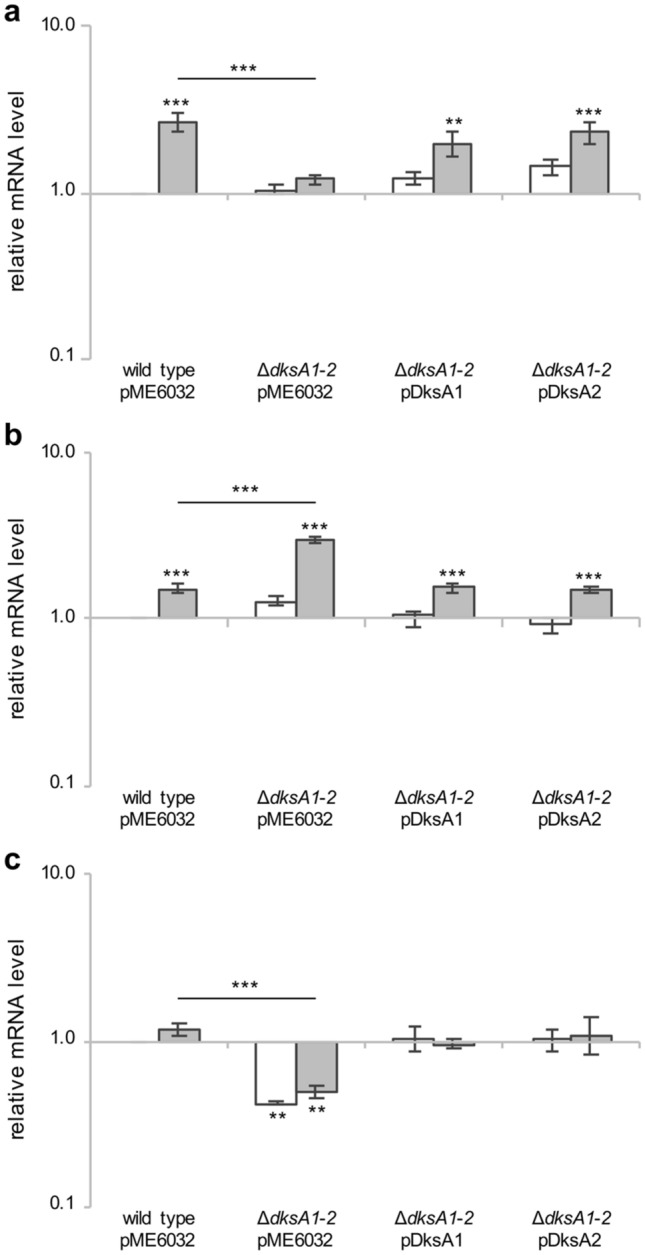
Figure 5.

Expression analysis of oxidative stress response genes. Bacterial cultures were grown to the exponential phase (OD600 ≈ 2.5) in LB supplemented with 0.1 mM IPTG, then incubated with or without 1 mM H2O2 for 20 min. The mRNA levels of katA (a), katB (b) and katE (c) were determined by Real Time PCR analysis. Gene expression in the indicated untreated (white bars) or treated (grey bars) strains was reported as fold change in gene expression relative to the level of each gene in the untreated wild type PAO1(pME6032) strain. The average of two independent analyses, each performed on three technical replicates, is reported with standard deviations. Asterisks above the horizontal lines refer to p values versus wild type challenged with 1 mM H2O2; asterisks above the bars refer to p values versus the untreated wild type; **p < 0.01, ***p < 0.001 (ANOVA).
