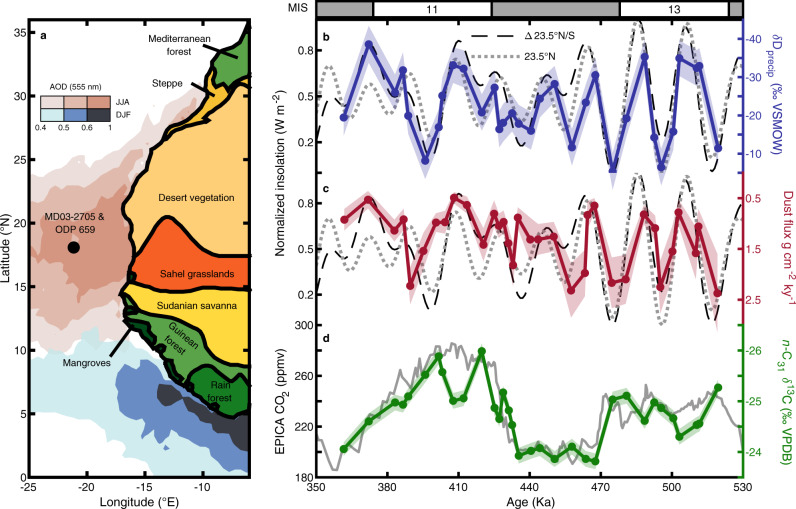
Fig. 1. Regional context and new records of monsoon rainfall, dust, and vegetation.
a Map of Northwest Africa with biome distributions on land ref. 54, the aerosol optical depth (AOD, 555 nm) (summer: JJA and winter: DJF, 2000–2017) over the ocean (Giovanni, NASA EarthData) showing the location of the modern summer and winter Saharan dust plumes (colorbar, ref. 127), the core location for MD03-2705 and ODP 659 is labeled with a black circle b δDprecip with 1σ uncertainty plotted with June 21 23.5°N insolation (dotted line, r = −0.77) and the summer inter-hemispheric insolation gradient June 21 23.5°N–23.5°S (dashed line, r = −0.76), insolation was determined using ref. 126 and normalized to values between 0 and 1. c 3HeET-normalized dust flux plotted with insolation curves as in a (23.5°N, r = −0.46; Δ23.5°N/S, r = −0.50). d Plant-wax C31 n-alkane δ13C with 1σ uncertainty plotted with EPICA ice core CO2 concentration ref. 128 (r = –0.81). δDprecip and 3HeET-normalized dust flux are also well correlated (r = 0.68). All correlation coefficients are significant at a p value of <0.01. Marine isotope stages (MIS) are indicated with interglacials periods shown in white and glacial periods in gray.

