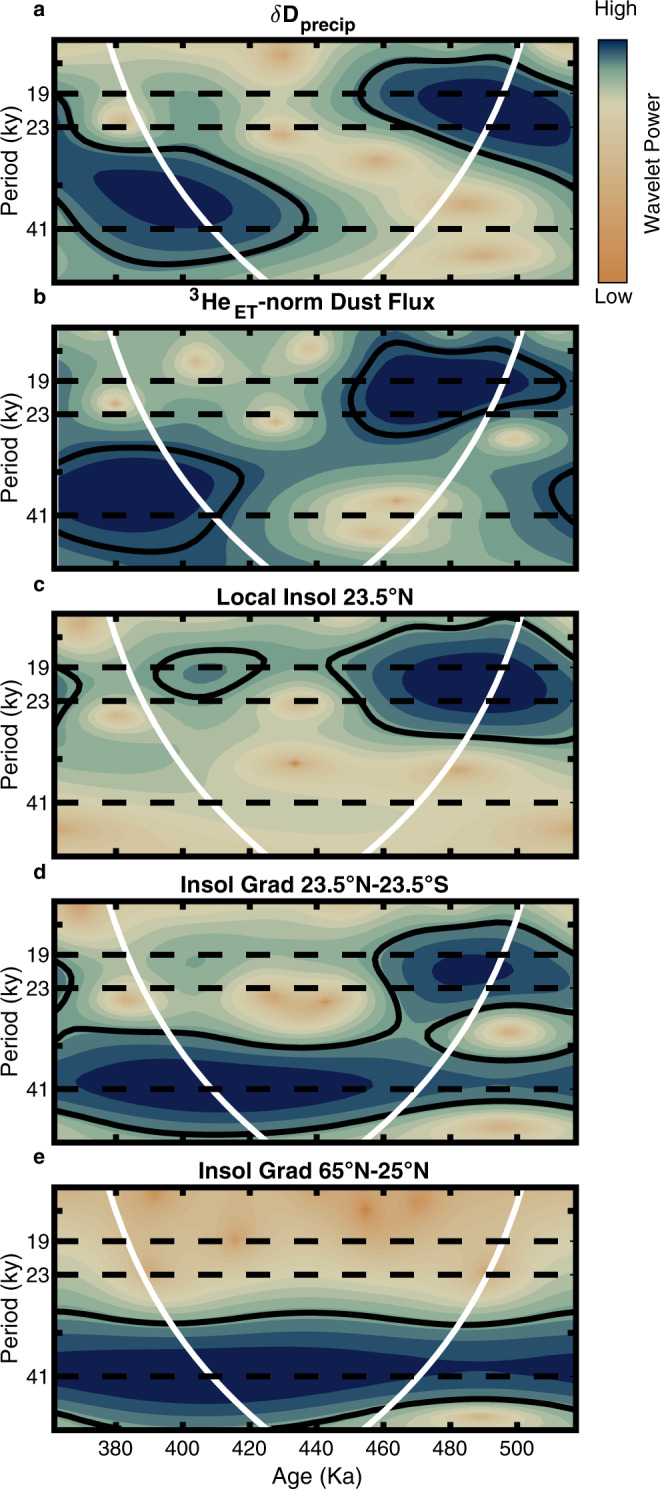
Fig. 2. δDprecip, dust flux, and insolation wavelet analysis.

Wavelet scalograms depicting power at different periods through time for a δDprecip record, b 3HeET-normalized dust flux, c local summer insolation, 23.5°N June 21, d summer inter-hemispheric insolation gradient 23.5°N–23.5°S June 21, e low to high-latitude summer insolation gradient, 25°N–65°N June 21. Continuous wavelet transforms were calculated following ref. 122 with all insolation time series sampled at wax isotope sample time points then interpolated to 3 kyr intervals. In all panels, the white parabola indicates the cone of influence. Black solid lines encompass intervals with power that is significant at the 95% significance level. Only the cross-equatorial insolation gradient can explain both the precessional and obliquity-driven components of the δDprecip and the 3HeET-normalized dust records.
