
Fig. 3. Comparison between MIS 13-10 and the last glacial cycle.
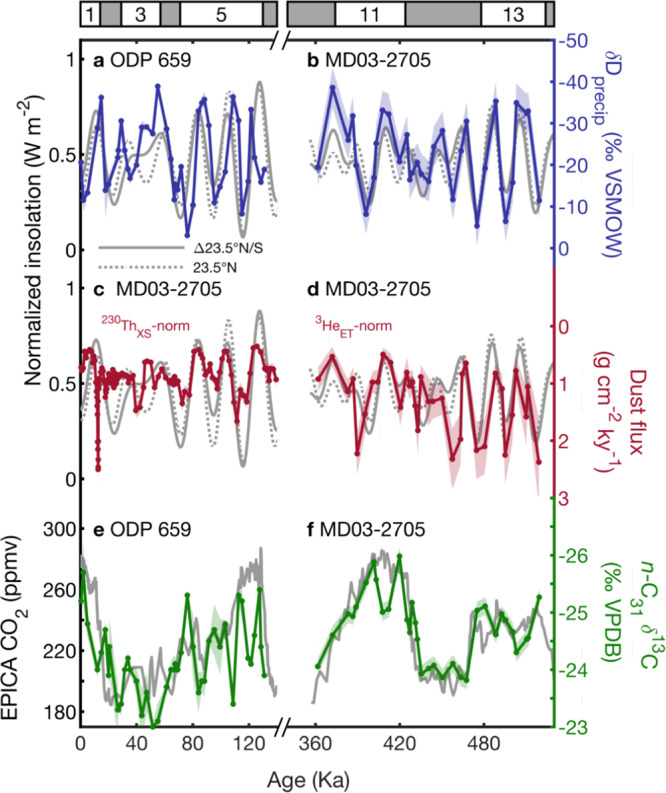
a δDprecip with 1σ uncertainty (ref. 42, blue line and shading) plotted with the normalized summer inter-hemispheric insolation gradient June 21 23.5°N–23.5°S insolation (solid gray line) and the normalized local insolation June 21 23.5°N (dashed gray line), b δDprecip (this study) plotted as in a, c 230ThXS-normalized dust flux with 1σ uncertainty (ref. 20, red line and shading) plotted with the summer inter-hemispheric insolation gradient June 21 23.5°N–23.5°S insolation (gray line), d 3HeET-normalized dust flux (this study) plotted as in c, e Plant-wax n-C31 δ13C with 1σ uncertainty (ref. 42, green line and shading) plotted with EPICA ice core pCO2 (ref. 128, gray line), f δDprecip (this study) plotted as in c. Note that MIS 6-1 and 13–10 dust fluxes use different methods that may have additional uncertainties when comparing them (see “methods” and Figs. S10, 11 for details).