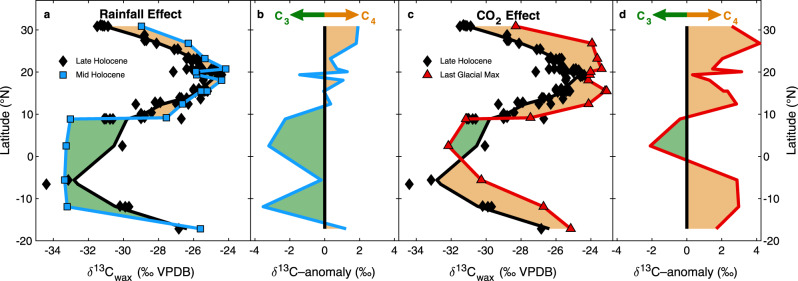
Fig. 4. Late Holocene, Middle Holocene and LGM patterns in latitudinal C3 and C4 vegetation distributions.
Plant-wax δ13C along the West African margin refs. 6,18,42,57,94,129–131 separated into late Holocene (2–0 ka, black diamonds), middle Holocene (8–6 ka, blue squares), and Last Glacial Maximum (23–19 ka, red triangles). Each transect is fit using a locally weighted scatter-plot smoothing (LOESS) function, (“smooth” function, MATLAB v2020a, see “methods” for details). The relative contribution of C4 v. C3 vegetation between intervals is shown in orange (greater C4) and green (greater C3) shading. a The effect of increased rainfall during the humid middle Holocene. b Middle Holocene – Late Holocene δ13Cwax anomalies calculated for each individual core c The effect of decreased atmospheric CO2 during the LGM. d LGM – Late Holocene δ13Cwax anomalies calculated as in b.

