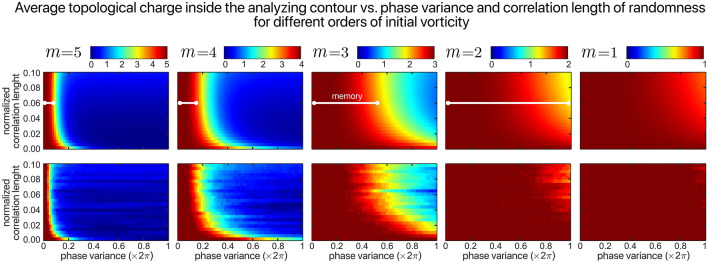
Figure 1.
Analytical (top row) and numerical (bottom row) illustration of the phase memory in optical vortex beams. The color scale represents the vorticity evaluated over a circular contour of radius for the case where the randomness is Gaussian distributed with . The spatial correlation length of randomness is normalized over the circumference of the POV. The numerical simulation data reflects an average over 50 realizations of randomness. The white lines indicate the range of phase variance where the initial vorticity can be recovered, i.e., the extent of "vortex memory".

