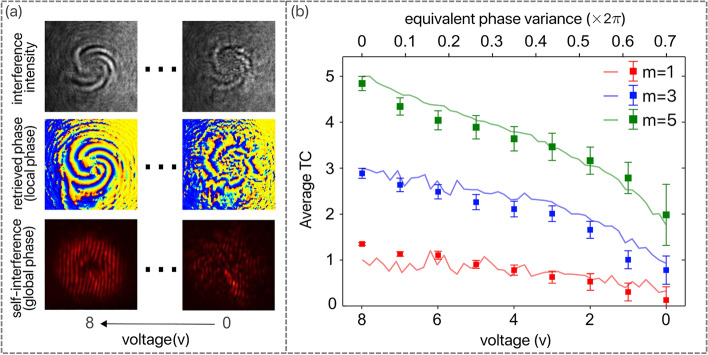
Figure 4.
Experimental results. Panel (a): an example of measured intensity and phase of the scattered field for case corresponding to the highest (voltage 0) and the lowest (voltage 8) scattering perturbation. All measurements are for the same propagation distance and the only adjustable parameter is the voltage applied to the heater. Panel (b): comparison between the experimental results (solid symbols, bottom axis) and the numerical calculation (solid lines, top axis) conducted for the specific scattering conditions. The experimental results were averaged over four measurements at different locations across the TPS while the numerical data was averaged over 30 realizations of the randomness. For both simulation and experiment, the vorticity was calculated over square contours around the optical axis. The equivalent extent of the phase variance was found based on the measured statistical properties of the TPS.

