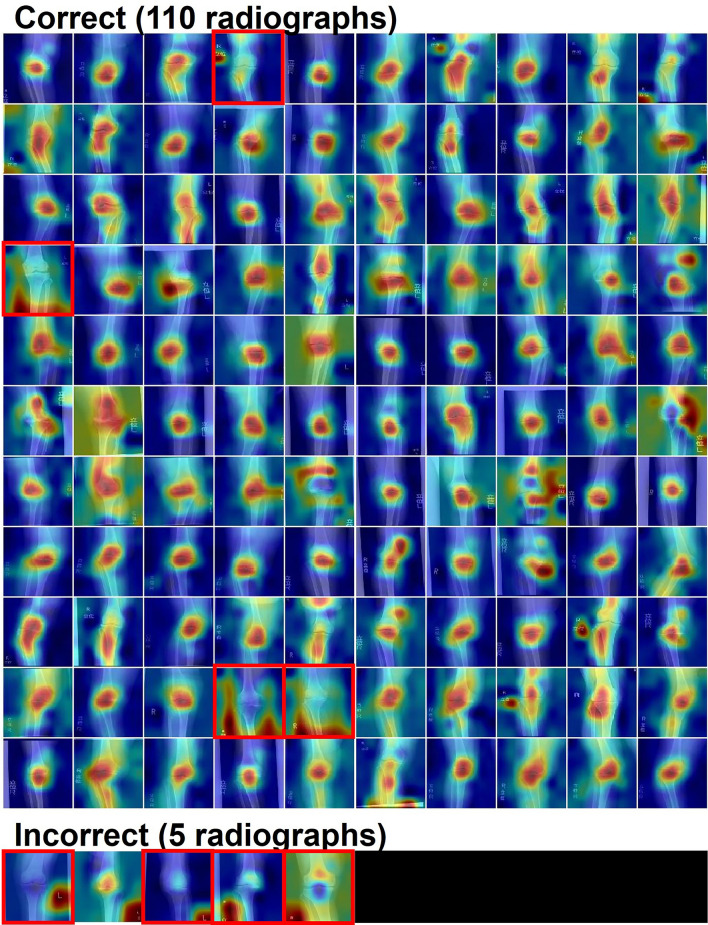
Figure 2.
Validation of the model with Grad-CAM on the datasets containing 115 radiographs of primary osteoarthritis. The red-colored region in the heatmap demonstrates the area with high contributed to the classification by the model. In 93.0% (107/115) radiographs, the class-discriminating area included joint areas. Eight radiographs where the class-discriminating area did not include joint area were surrounded by red rectangles. Correct; radiographs which were correctly classified as ‘OA’, Incorrect; radiographs which were incorrectly classified as ‘RA’.

