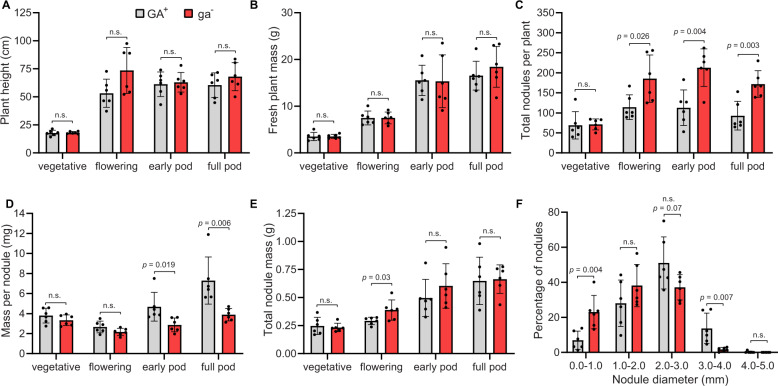
Fig. 2. Effect of GA operon knockout in the Bradyrhizobium-soybean symbiosis.
Soybean plants were nodulated with either wild-type, GA-producing B. diazoefficiens USDA 110 (GA+) or the GA operon-knockout B. diazoefficiens KB2011 (ga−). Representative plants (n = 6) were harvested at four time points (vegetative, flowering, early pod, and full pod stages) to measure the following phenotypes: A average plant height, B plant fresh mass, C the average number of nodules per plant, D the average mass per nodule for each plant, and E average total nodule mass per plant. F Nodule size distribution of soybean nodulated with GA+ or ga− B. diazoefficiens. The diameters of individual nodules collected at the soybean full pod stage were measured and binned into defined size groups. The distribution of nodule sizes are represented as the percentage of the total nodule number of the plant. n = 6 plants per condition at each time point. For all bar graphs, the mean is shown with ± standard deviation (SD). Statistical significance was assessed at each time point using an unpaired, two-tailed t-test; n.s. = not significant (p > 0.05). Individual p values are shown when ≤0.1.

