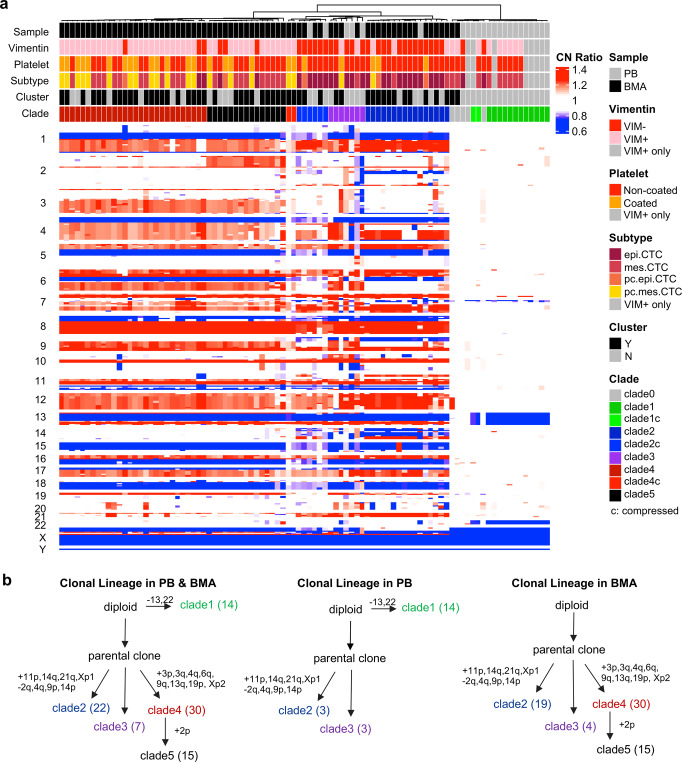
Fig. 3. Clonal lineage and its variation between PB and BMA.
a Complex heatmap of single cell copy number profiles from paired PB and BMA grouped by hierarchical clustering. The “c” in clade IDs means compressed profile due to normal cell contamination. Red, copy number gain; blue, copy number loss; white, copy number neutral. VIM + only refers to “VIM + only” rare cells. b Clonal lineage in PB and BMA combination and separate. The number in parenthesis is the number of cells analyzed.

