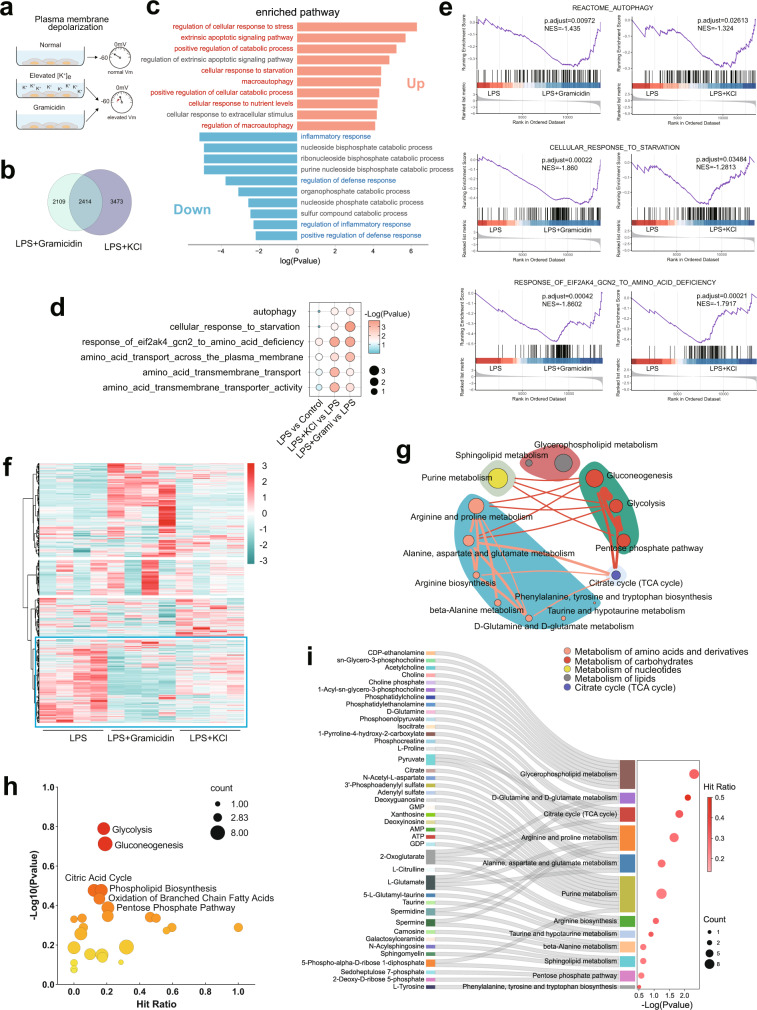
Fig. 1. Macrophage Vm is essential for nutrient acquisition to fuel inflammation.
a Strategy for depolarizing macrophages and membrane potential measurement. b, c Overlap analysis of differentially expressed genes in mouse BMDMs treated with 500 ng/ml LPS in the presence or absence of elevated [K+]e (50 mM) or gramicidin (1.25 μM) for 6 h. The pathway enrichment analysis of overlapped downregulated (reference threshold: fold-change, <0.7; p value, <0.05) and upregulated (reference threshold: fold-change, >1.3; p value, <0.05) genes were performed in Metascape. d, e GSEA of mouse BMDMs treated with 500 ng/ml LPS in the presence or absence of elevated [K+]e (50 mM) or gramicidin (1.25 μM) for 6 h. f Heatmap of metabolites identified in unbiased metabolomics. (n = 4). Data analyzed by RStudio and the row clustering distance and clustering method were “euclidean” and “ward.D2”, respectively. The highlighted cluster represents metabolites downregulated in both the elevated [K+]e and gramicidin groups versus the LPS group. g–i Pathway Enrichment analysis of metabolites in the highlighted cluster with MetaboAnalyst 5.0 based on the KEGG database (h), SMPDB (The Small Molecule Pathway Database) database (i), and the combined KEGG and SMPDB database analysis (g). The enriched metabolic pathways are categorized into different pathway groups based on the Reactome metabolic pathway database. The size of circle for each pathway represent counts of enriched metabolites. The thickness of lines between pathways represents counts of common metabolites between groups (g). Source data are provided as a Source Data file.

