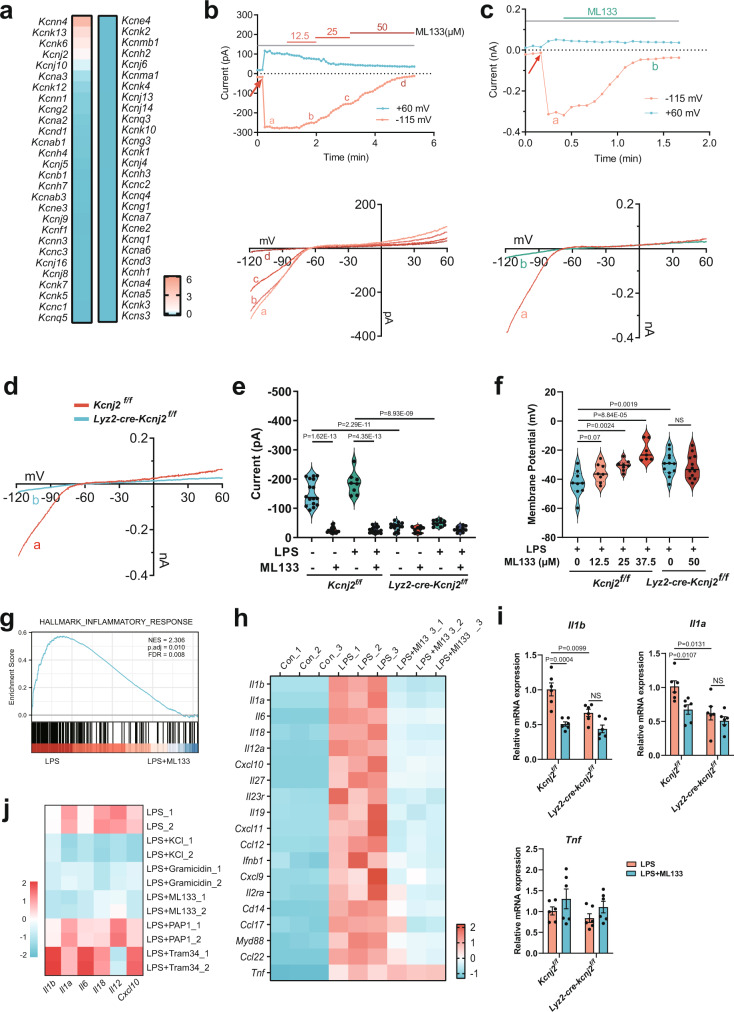
Fig. 2. Kir2.1 is a critical regulator of macrophage Vm driving inflammation.
a Expression profile of K+ channels in mouse bone marrow-derived macrophages (BMDMs) analyzed by RNA-seq (n = 3). The FPKM data of different genes are standardized to the Z-score by column in IBM SPSS Statistics. b–d Electrophysiological properties of freshly isolated WT (b–d) and Kir2.1-knockout (d) mouse peritoneal macrophages using patch-clamp. Thioglycolate-elicited mouse peritoneal macrophages were treated with (b) or without (c) 500 ng/ml LPS for 1 h before recording. The time-dependent current traces were recorded at a clamp voltage of –115 mV or +60 mV (red arrow, initiation of recording). The lower panel shows the I–V curves of the corresponding points for different doses of ML133 in the left panel. d Representative I–V curves of WT and Kir2.1-knockout mouse peritoneal macrophages. e Statistics of current amplitude recorded at a clamp voltage of –115 mV. Macrophages were treated and clamped as described above (Kcnj2f/f, n = 16, 18, 8, and 17 respectively; Lyz2-cre-Kcnj2f/f, n = 16, 9, 10, and 10 respectively; mean ± SEM). f Statistics of Vm recorded at 3 min after initiation of recording (Kcnj2f/f, n = 10, 7, 8, 9, 9, 8, 8, and 7, respectively; Lyz2-cre-Kcnj2f/f, n = 9, 8, 12, and 12, respectively; mean ± SEM). g, h RNA-seq analysis of inflammatory genes. GSEA analysis showing enrichment of the inflammatory response genes (g) and heatmap of inflammatory genes (h). NES, normalized enrichment score; FDR, false discovery rate. (n = 3). i Il1a, Il1b, and Tnf mRNA transcription assays. Mouse peritoneal macrophages from WT or Lyz2-cre-Kcnj2f/f mice treated with 500 ng/ml LPS for 6 h in the presence or absence of ML133 (25 μM) followed by qPCR analysis (n = 6, mean ± SEM). j Mouse peritoneal macrophages treated with or without 500 ng/ml LPS in the presence or absence of elevated [K+]e (50 mM), gramicidin (1.25 μM), ML133 (25 μM), PAP1 (Kv1.3 inhibitor, 1 μM), Tram34 (KCa3.1 inhibitor, 1 μM) for 6 h followed by qPCR analysis of mRNA transcription. Two-tailed unpaired Student’s t-test. Source data are provided as a Source Data file.

