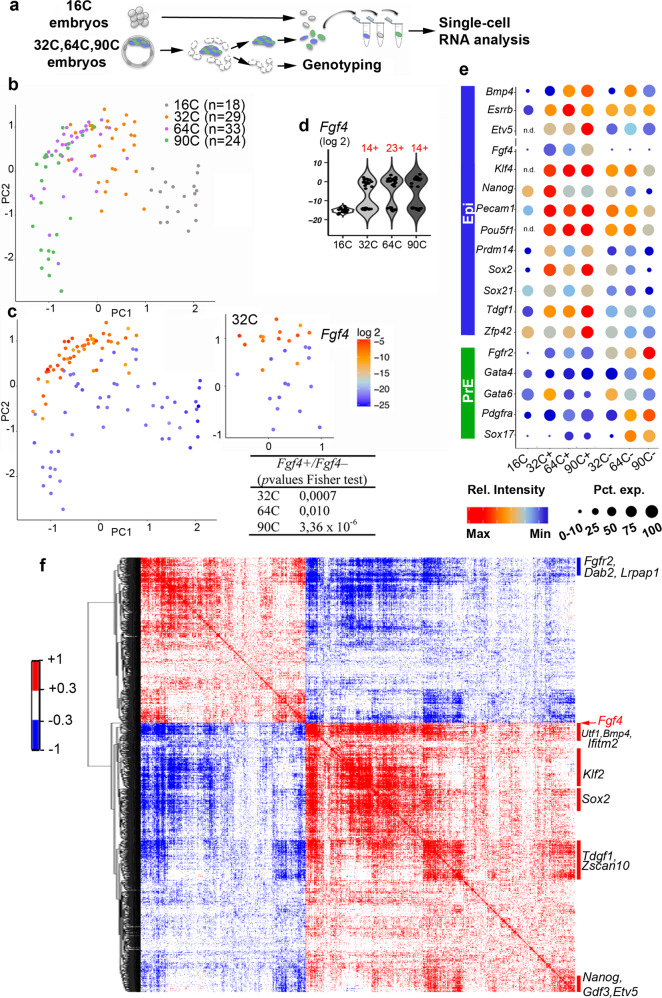
Fig. 1. Emergence of two cell populations in 32C mouse embryos.
a Single-cell isolation procedure for RT-qPCR analyses. b, PCA map where developmental stages are represented by the indicated colours (PC1 Score= 24.40%, PC2 score = 14.77%, PC3 score <0.01). c PCA plot shown in (b) with graded colours to indicate Fgf4 expression level in each cell at the four stages (left panel) and at 32C only (right panel). The table shows the Fisher’s exact test values for Fgf4+ and Fgf4− cell distributions. d Violin plot of Fgf4 expression level in individual cells. The number of Fgf4 + cells at each stage is indicated in red. e Seurat plot showing the single-cell expression level of the indicated genes at the four stages in the Fgf4+ and Fgf4− populations, according to the violin plots shown in (d). The colour intensity represents the average expression level, whereas the dot size represents the proportion of cells that express the gene within the population (for each cell, values >0.10 of the gene maximal intensity were considered as positive). f Spearman correlation matrix for the paired expression of 1434 genes (selected by their correlation with Fgf4 expression) in the 40 ICM cells at stage 32C. Genes are ordered in a hierarchical tree for similarity (see Supplementary data 4 for a detailed map in a vector-based PDF file). Source data are provided in the Source Data file.

