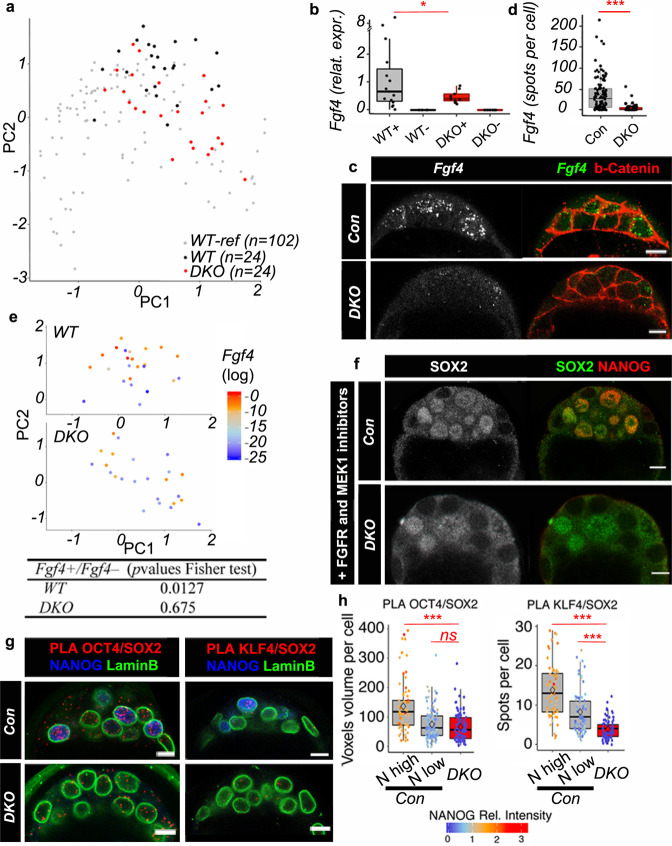
Fig. 3. Cell heterogeneity in DKO ICMs.
a PCA performed with DKO and WT cells (32–50C) and with WT cells from Fig. 1a, b (16C, 32C, 64C and 90C) as reference (WT-Ref) (scores: PC1, 20.84%; PC2, 13.13%). b Boxplot showing Fgf4 expression levels in Fgf4+ and Fgf4− populations (+ and −) in WT (n = 4 embryos) (15 cells Fgf4+ and 9 cells Fgf4-) and DKO (n = 4) (9 cells Fgf4+ and 15 cells Fgf4−); Fligner-Killeen test for homogeneity of variance (between WT and DKO Fgf4+ cells p value = 0.012. c Representative images of Fgf4 HCR RNA-FISH, coupled with b-Catenin IF, in 64C DKO (n = 4) and control embryos. Scale bars: 10 µm. d Quantification of HCR RNA-FISH spots in ICM cells from control (n = 115 cells from 7 embryos) and DKO (n = 77 cells from 4 embryos) embryos (Fligner-Killeen test p value < 2.2 e−16). e PCA map from (a) with WT (top panel) and DKO (bottom panel) cells only, and with graded colours indicating Fgf4 expression level. Fisher’s exact test p-values (bottom table). f Representative immunofluorescence images of 64–90C control and DKO (n = 6) embryos cultured with FGFR and MEK1 inhibitors showing SOX2 and NANOG localization. Scale bars: 10 µm. g Representative images after SOX2/OCT4 and SOX2/KLF4 PLA, coupled with LaminB and NANOG immunofluorescence in control and DKO embryos (n = 4 for SOX2/OCT4; n = 4 for SOX2/KLF4). Scale bars: 10 µm. h Quantification of PLA signals per nucleus from (g). N high, cells with high NANOG expression; N low, cells with low NANOG expression. For SOX2/OCT4: n = 65 N high cells, n = 102 N low cells and n = 91 DKO cells. For SOX2/KLF4: n = 62 N high cells, n = 80 N low cells and n = 79 DKO cells. Pairwise Wilcoxon comparisons after a two-sided Kruskal-Wallis test of the three cell populations (***p < 0.01; ns=not significant; exact p-values: for OCT4/SOX2 between N high and DKO cells p = 4.0 e−08; for OCT4/SOX2 between N low and DKO cells p = 0.15; for KLF4/SOX2 between N high and DKO cells p < 2.2 e−16; or KLF4/SOX2 between N high and DKO cells p = 4.4 e−10. For boxplots: The edges of the box represent the 25th and 75th quartiles. The median is represented by the central line. The whiskers extend to 1.5 times the interquartile range (25th to 75th percentile). Cells are plotted individually. Source data are provided in the Source Data file.

