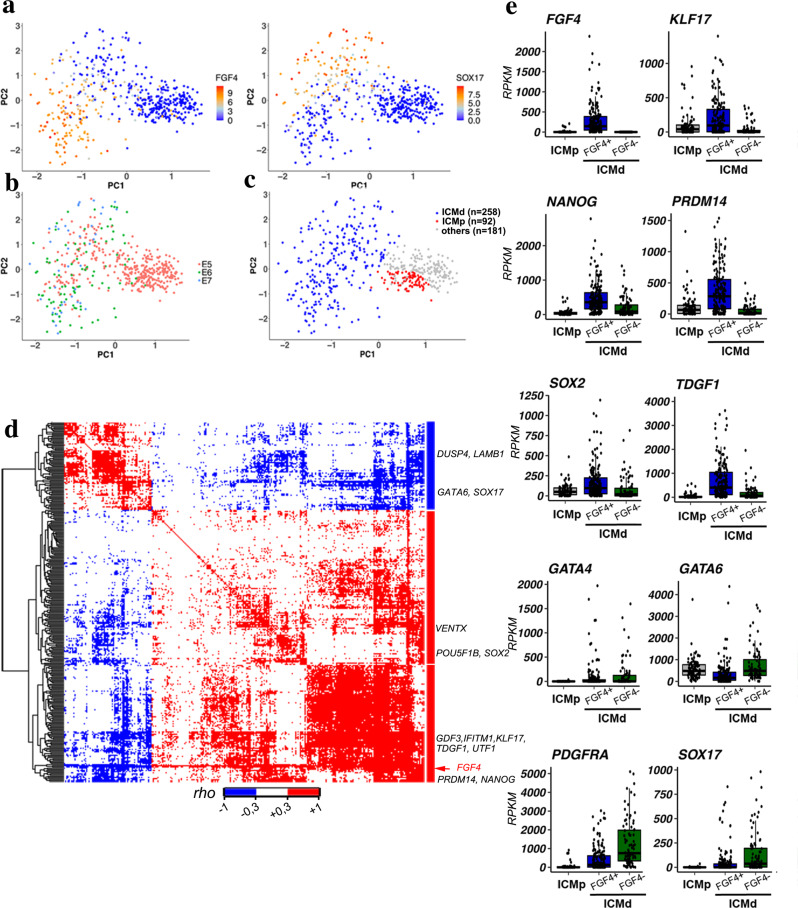
Fig. 4. Single-cell RNA sequencing data analysis in human ICMs.
a PCA map of human cells from 52 embryos with graded colours indicating FGF4 and SOX17 expression levels in E5 cells and E6-E7 ICM cells (PC1 Score= 28.09%, PC2 score = 11.34%, PC3 score = 6%). b Same PCA plot as in (a) where developmental stages are represented by the indicated colours. c Same PCA plot showing ICMd and ICMp cells (see Supplementary data 8 for the list of cells and their allocation). d Spearman correlation matrix for paired expression of the 308 FGF4-correlated genes in the 258 human ICMd cells. Genes are ordered in a hierarchical tree for similarity (see Supplementary data 9 for detailed map in the vector-based PDF file). e Single cell normalized expression levels of Epi and PrE markers in ICMp (n = 88) and ICMd (FGF4+ (n = 172) and FGF4- (n = 86)) cells (Supplementary data 8); Two-sided Wilcoxon test between FGF4+ and FGF4- ICMd cells (p-values: FGF4 p < 2.00 e−16; KLF17 p = 5.80 e−11; NANOG p = 5.40 e−09; PRDM14 p < 2.00e−16; SOX2 p = 6.10e-08; TDGF1 p = 2.40 e−13; GATA4 p = 0.38; GATA6 p = 3.10 e−12; PDGFRA p = 1.40 e−11; SOX17 p = 8.00 e−08). For boxplots: The edges of the box represent the 25th and 75th quartiles. The median is represented by the central line. The whiskers extend to 1.5 times the interquartile range (25th to 75th percentile). Cells are plotted individually.

