
Figure 3.
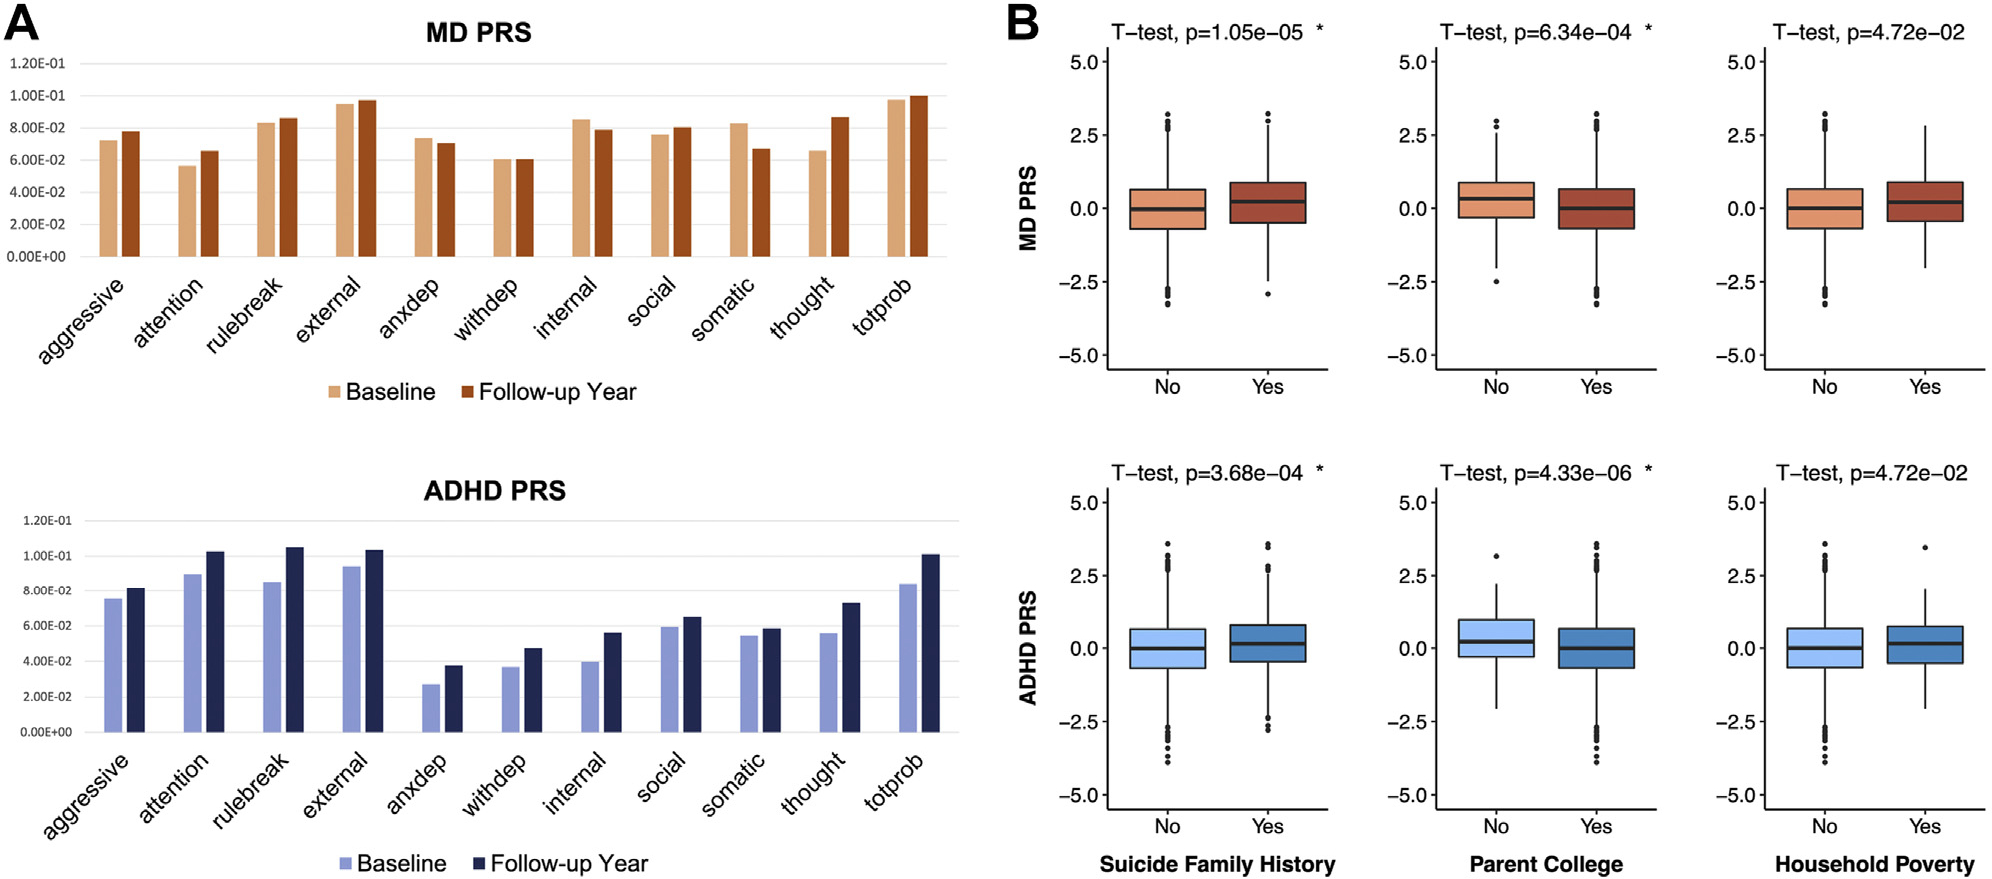
Association analysis results of major depression (MD) and attention-deficit/hyperactivity disorder (ADHD) polygenic risk scores (PRSs) with known risk factors of suicide. (A) Partial correlations were measured between PRSs and 11 Child Behavior Checklist items, conditioning on age, sex, and 10 genetic principal components to control for potential population substratification within Europeans. The y-axis represents the t-statistics of partial correlation measures. (B) The t-test results for comparing ADHD and MD PRSs between 2 groups of participants stratified by various risk factors. Participants were divided into two groups based on family history of suicide, parent college education, and poverty. Poverty was set at yes if the household income of the participants was less than $20,000 annually. The top panels display MD PRS scores on the y-axis, while the bottom panels show ADHD PRS scores. aggressive = aggressive behavior; anxdep = anxious/depressed; attention = attention problems; external = externalizing problems; internal = internalizing problems; rulebreak = rule-breaking behavior; social = social problems; somatic = somatic complaints; thought = thought problems; totprob = total problem score; withdep = withdrawn/depressed.