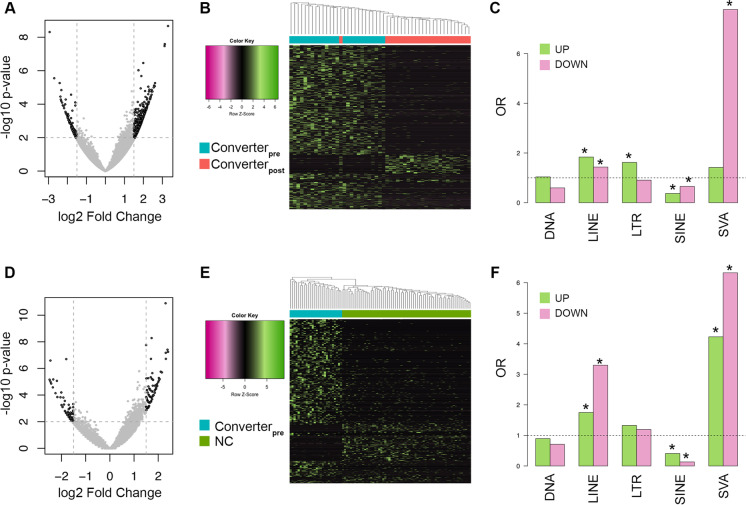
Fig. 2.
Differential analysis of TE expression. A Volcano plot of the results from the differential expression analysis of TE transcripts in the Converterpre vs Converterpost comparison. Significant RNA transcripts at logFC ± 1.5 and p value ≤ .01 are highlighted in black. B Scaled heatmap and unsupervised hierarchical clustering of the log2 TMM values of the 1790 TEs identified as differentially expressed in the Converterpre vs Converterpost comparison. Samples are annotated with different colors according to the group (Converterpre or Converterpost). C Enrichment analysis for up- and down-regulated differentially expressed TE transcripts according to their class. Stars mark significantly enriched TE classes (Fisher’s exact test p value ≤ .01). D, E, F The panels reports the same plots described above, but for the Converterpre vs NC comparison

