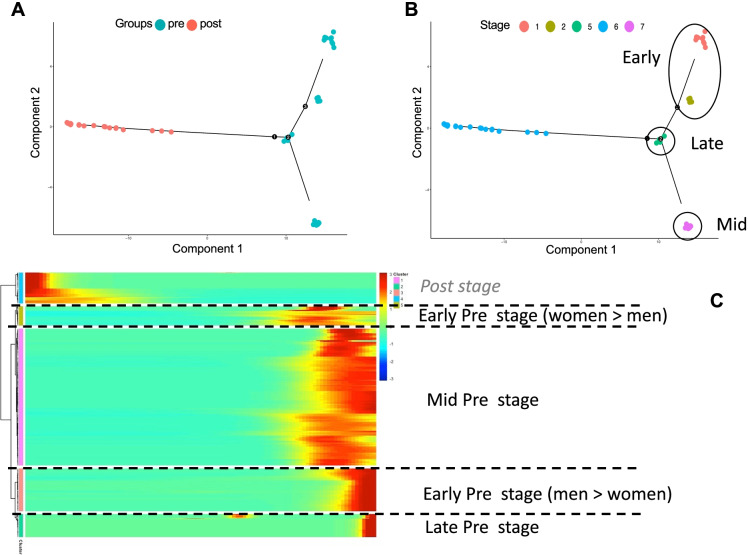
Fig. 4.
A and B show the pseudotime continuum from a Converterpre (dots on the right side) to a Converterpost (dots on the left side) for the subjects that developed AD during the period of observation. Dots represent subjects: in A, blue dots are subjects at their Converterpre condition and red dots are those at their Converterpost condition. In B, blue dots show the Converterpost condition for subjects; the other colors show different Converterpre stages. C A heatmap expression matrix for significant DE TEs at the 3 (early, mid, and late) Converterpre stages in addition to the Converterpost phase

