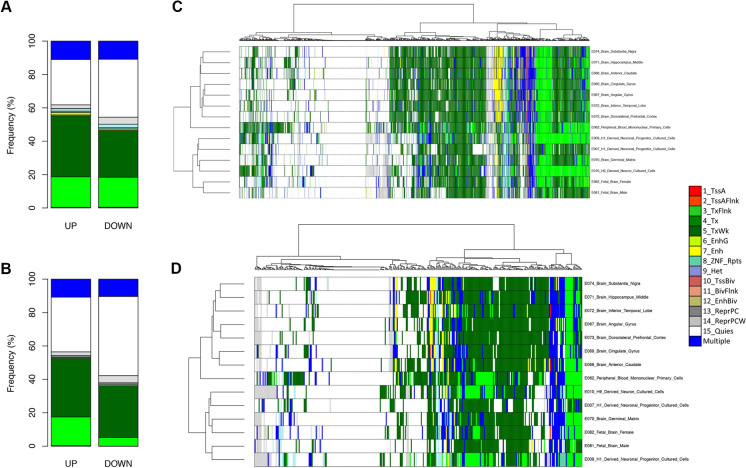
Fig. 5.
Chromatin states of DE TE. A, B Distribution of up- and down-regulated DE TE across the chromatin states included in the Core 15-state model in blood cells, considering Converterpre vs Converterpost (A) and Converterpre vs NC (B) comparisons. C, D Heatmaps with unsupervised clustering of the chromatin states in blood cells, and adult and fetal brain tissue considering the genomic regions overlapping with DE TEs from Converterpre vs Converterpost (C) and Converterpre vs NC (D) comparisons. In all the plots, colors of the chromatin states are shown in the legend and correspond to those used in the Epigenomic Roadmap website; DE TEs whose genomic location encompasses multiple chromatin states are colored in blue

