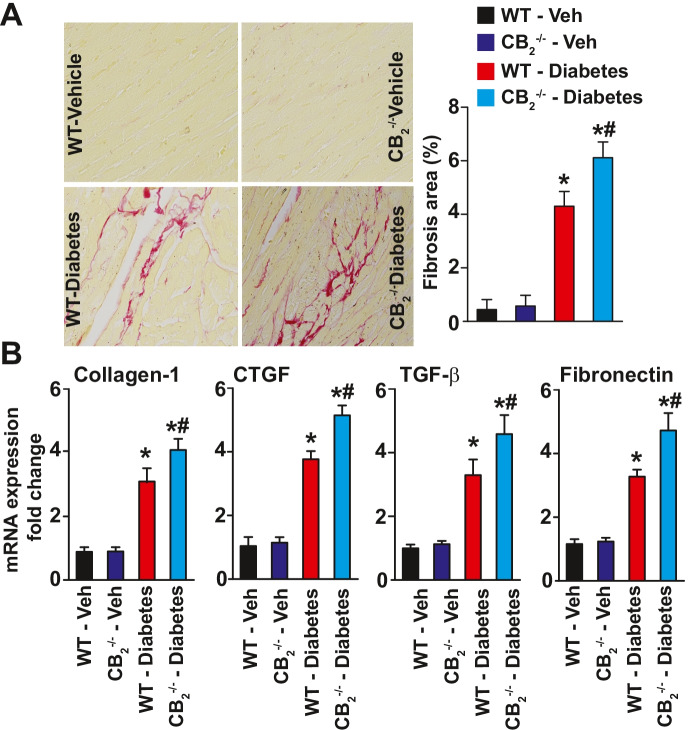
Fig. 9.
Effect of diabetes-induced fibrosis in the myocardial tissues of CB2R−/− mice. A Representative images show Sirius red staining of the myocardial paraffin sections. The adjacent panel shows the quantification of fibrosis. *P < 0.05 vs. WT-vehicle treated animals; #P < 0.05 vs. diabetes, n = 6. B Depicts the mRNA expression of fibrosis markers in the myocardial tissue samples. *P < 0.05 vs. WT-vehicle treated animals; #P < 0.05 vs. WT diabetic animals, n = 6

