Fig. 1.
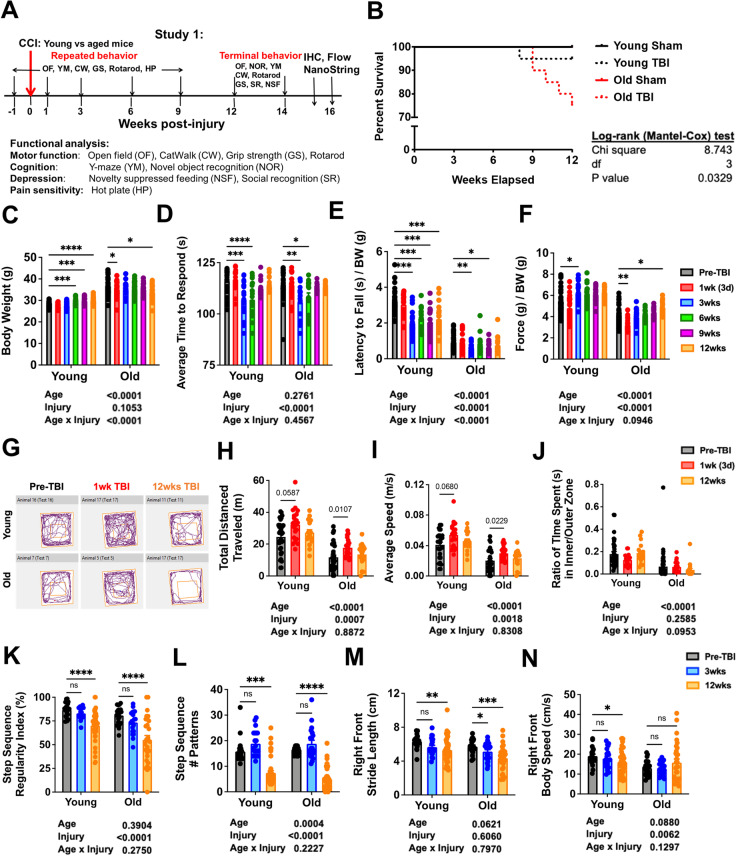
Effects of age on long-term survival and motor recovery after TBI. A Schematic diagram illustrating timepoints by weeks pre- or post-injury and of repeated or terminal behavior experiments conducted throughout study 1. Baseline behavior testing aimed at assessment of motor, cognition, and pain sensitivity was performed at 1 week before injury, followed by a moderate controlled cortical impact (CCI) injury on the left cerebral cortex of mice randomly designated to the injury groups. Repeated behavior tests were performed on 1, 3, 6, and 9 weeks post-injury. Terminal behavior for motor, cognitive, and depression-like behavior were carried out between 12 and 14 weeks post-injury before euthanizing the mice for immunohistochemistry, flow cytometry, and NanoString analysis. B Survival plot of young and old mice in weeks elapsed for study 1. Compared to old sham (N = 12) and young sham (N = 13), both TBI injury groups (N = 20/group) show decreased survival rates, with old TBI group having the lowest survival rate of all mice. Kaplan–Meier survival curves were analyzed using the log-rank Mantel-Cox test. C Graph depicting body weight data of young and old mice at baseline and follow-up measurements post-injury. D Graph depicting latency time to withdrawal in hot plate test for thermal sensitization. Both age groups displayed thermal hyperalgesia between 3 and 6 weeks post-injury, but no age effect was observed. E Graph depicting rotarod data from baseline to 12 weeks post-injury. F Graph depicting grip strength measurements from baseline to 12 weeks post-injury. G Representative graph of spontaneous movement by young and old mice in the open field test at baseline, 3 weeks, and 12 weeks after TBI. H–J Spontaneous locomotor activity in an open field apparatus was recorded and analyzed with use of the AnyMaze animal behavior system. Injury effects could be observed in two parameters: total distance travelled (H) and average speed (I). Age effects could be observed in all three parameters depicted. K–N Graphs depicting parameters of CatWalk gait analysis tested at baseline, 3 and 12 weeks post-injury. Two-way ANOVA followed by Tukey’s post hoc test. ****p < 0.0001, ***p < 0.001, ** p < 0.01, * p < 0.05

