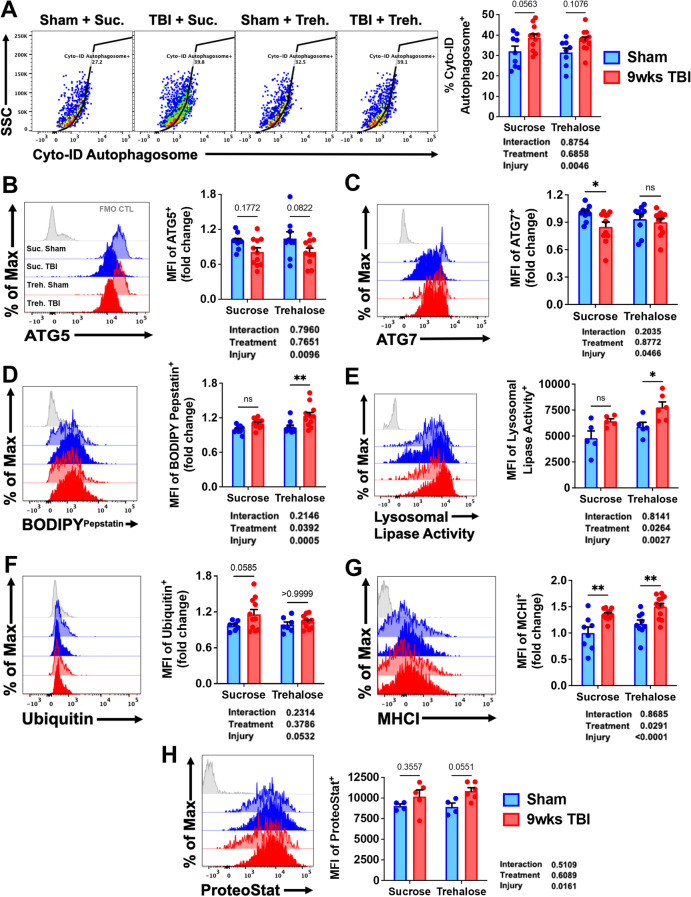
Fig. 14.
Trehalose treatment modulates multiple steps of the autophagy pathway in microglia. A A representative dot plot depicts the percentage of LC3II-positive autophagosomes in microglia at 9 weeks after TBI. Representative histograms show the relative protein expression level of the autophagy-related proteins B ATG5 and C ATG7 in microglia. Significant effects of trehalose treatment were seen in fluorescence intensity of D BODIPYPepstatin and E lysosomal lipase activity. Mean fluorescence intensities for F ubiquitin and G MHCI are quantified. H A main effect of injury was demonstrated in cytosolic protein aggregation as was measured using Proteostat dye. For all histograms, gray = FMO control, sucrose (vehicle) treated = blue, trehalose treated = red, sham controls = no fill, and TBI groups = bold fill. N = 9–10/group (A–D and F–G) and N = 4–6/group (E and H). Data were analyzed using 2-way ANOVA group analysis with Tukey’s test for multiple comparisons. **p < 0.01, *p < 0.05

