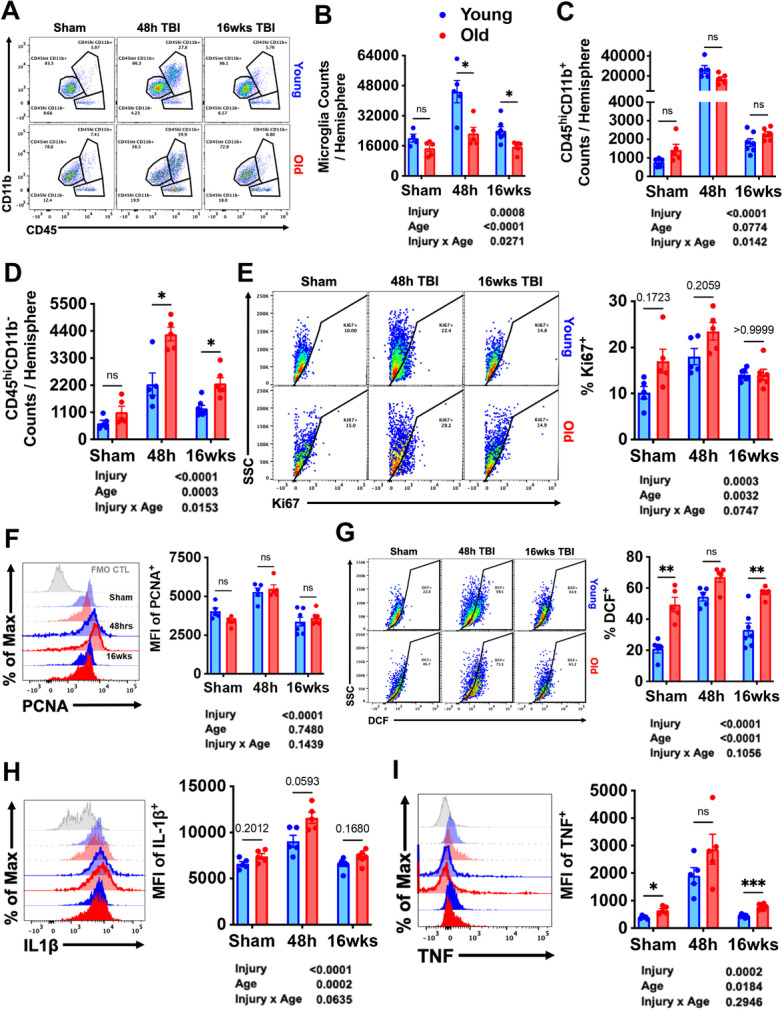
Fig. 8.

The effects of old age on the central immune response to TBI. A A representative dot plot of leukocyte populations in the brain at 48 h and 16 weeks after TBI. Quantification of CD45intCD11b+ microglia (B), CD45hiCD11b+ myeloid cells (C), and CD45hiCD11b− putative lymphocyte (D) cell counts are shown. Microglial proliferation as measured using cell cycle markers. A main effect of injury was seen in Ki67 (E) and PCNA (F) expression, driven largely by the increase at 48 h after TBI. Reactive oxygen species (ROS) and oxidative stress were measured using DCF. Main effects of age and injury were seen in microglial ROS levels (G). Pro-inflammatory cytokine production was assessed. The relative expression level of IL-1β (H) and TNF (I) in microglia is shown. For all histograms, gray = FMO control, blue = young, red = old, sham = no outline/no fill, 48 h TBI = bold outline/no fill, and 16w TBI = bold outline/bold fill. N = 5–7/group. Data were analyzed using 2-way ANOVA group analysis with Tukey’s test for multiple comparisons. ***p < 0.001, **p < 0.01, *p < 0.05
