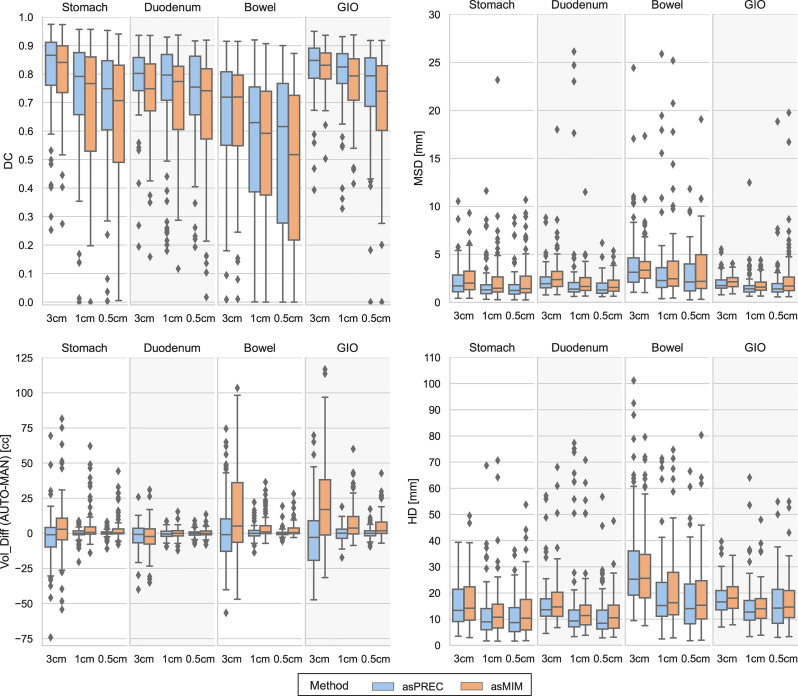
Figure 2.
Boxplots showing the differences between Dice coefficient (DC) [top left], mean surface distance (MSD) [top right], volumetric difference between auto vs. manual contours (VOL_DIFF) [bottom left] and Hausdorff distance (HD) [bottom right] for structures autosegmented with Precision (asPREC in blue) and MIM (asMIM in orange). Each column of each subfigure distinguishes the boxplots on each structure (stomach, duodenum, bowel and GIO) and for each organ, distributions are separated for the clipped structures at 3, 1 and 0.5 cm from the PTV.

