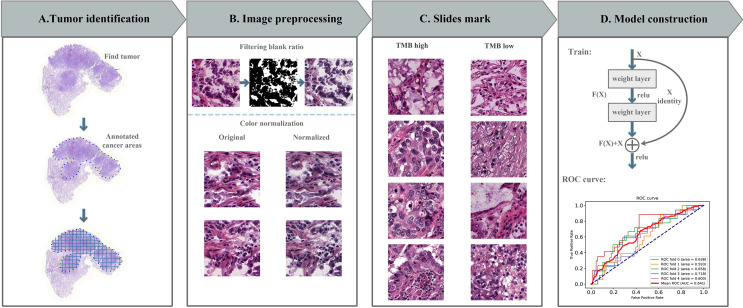
Figure 1.
Computational pipeline for predicting TMB in lung cancer. (A) The tumor area was annotated by a professional pathologist and cut into 512*512 image blocks. (B) Image processing includes noise reduction (discarding image blocks with a blank rate greater than 30%) and color normalization (Macenko method). (C) Divide TMB high and low with 10 as the threshold. (D) The prediction model was constructed with residual network, the model was tested with 5-fold cross-validation, and receiver operating characteristic (ROC) curve was used to evaluate the model.

