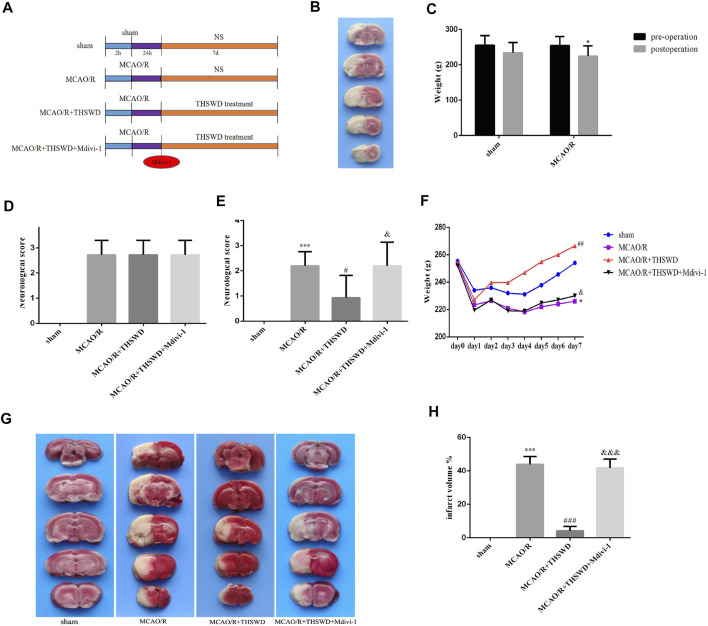
FIGURE 1.
Effects of THSWD on CIRI. (A) The flow diagram of the experiment. (B) Picture of brain TTC staining in MCAO/R model rat. (C) Weight change before and after MCAO/R. * p < 0.05 versus sham group (weight loss). (D) Neurological deficit scores before drug administration. The scores were not statistically different between the groups except for the sham-operated group. (E) Neurological deficit scores after treatment. n = 15 per group. (F) Daily body weight of rats in each group. n = 15 per group. (G) Representative pictures of TTC staining. (H) Quantitative analysis of cerebral infarct volumes; n = 5 per group. ∗ p < 0.05 versus sham group, *** p < 0.001 versus sham group, # p < 0.05, ## p < 0.01, ### p < 0.001 versus MCAO/R group, & p < 0.05, &&& p < 0.001 versus MCAO/R + THWSD group.

