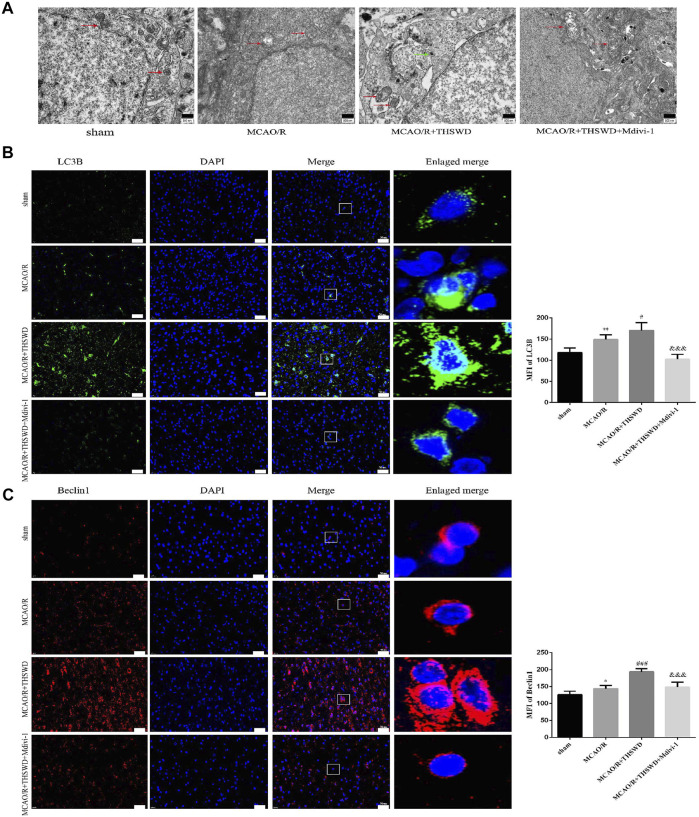
FIGURE 3.
Effects of THSWD treatment on Mitochondrial structure and autophagy proteins. (A) Ultrastructural changes in mitochondria. Scale bar = 500 nm. The red arrows marked the mitochondria, and the green arrows marked the many autophagic vesicles that wrapped around the mitochondria and fused with the lysosomes in the MCAO/R + THSWD group. (B,C) Immunofluorescence staining of LC3B and Beclin1 (×400). Scale bar = 50 μm. The mean fluorescence intensities (MFI) of LC3B and Beclin1 are quantified in the right-hand histogram. n = 4 per group. * p < 0.05, ** p < 0.01 versus sham group, # p < 0.05, ### p < 0.001 versus MCAO/R group, &&& p < 0.001 versus MCAO/R + THWSD group.

