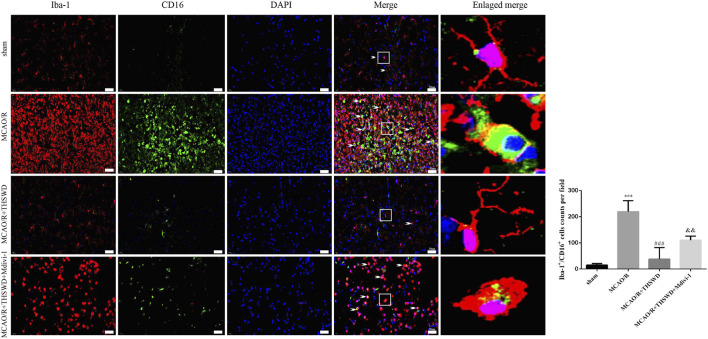
FIGURE 6.
THSWD treatment inhibits microglia activation. Microglia activation was observed by immunofluorescence detection of Iba-1/CD16 (×400). Scale bar = 50 μm. Quantification of Iba-1+/CD16+ cells counts in the right-hand bar graph. n = 4 per group.*** p < 0.001 versus sham group, ### p < 0.001 versus MCAO/R group, && p < 0.01 versus MCAO/R + THSWD group.

