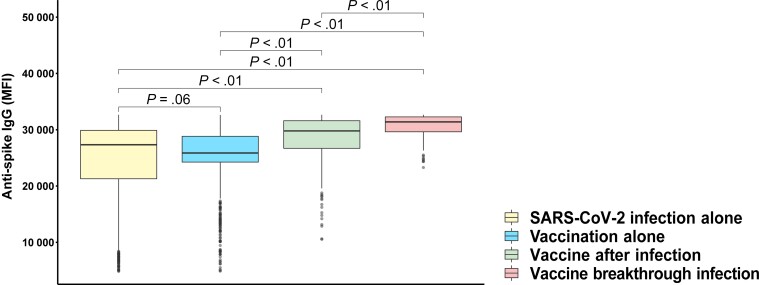
Figure 2.
Unadjusted comparison of peak observed anti-spike–IgG MFI by category of infection and/or vaccination. P value determined using the Mann-Whitney U test. These comparisons do not adjust for sampling time, which varies by group. Box plots denote median, first quartile (25th percentile), and third quartile (75th percentile) of anti-spike–IgG MFI levels (y-axis) and each group (x-axis) representing SARS-CoV-2 infection alone (yellow), vaccination alone (blue), vaccine after infection (light green), and vaccine breakthrough infection (coral). SARS-CoV-2 infection alone and vaccination alone did not portray any statistically significant difference, but vaccination after vaccine-breakthrough SARS-CoV-2 infection shows greater humoral response compared with infection alone or vaccination alone. Abbreviations: IgG, immunoglobulin G; MFI, median fluorescence intensity; SARS-CoV-2, severe acute respiratory syndrome coronavirus 2.

