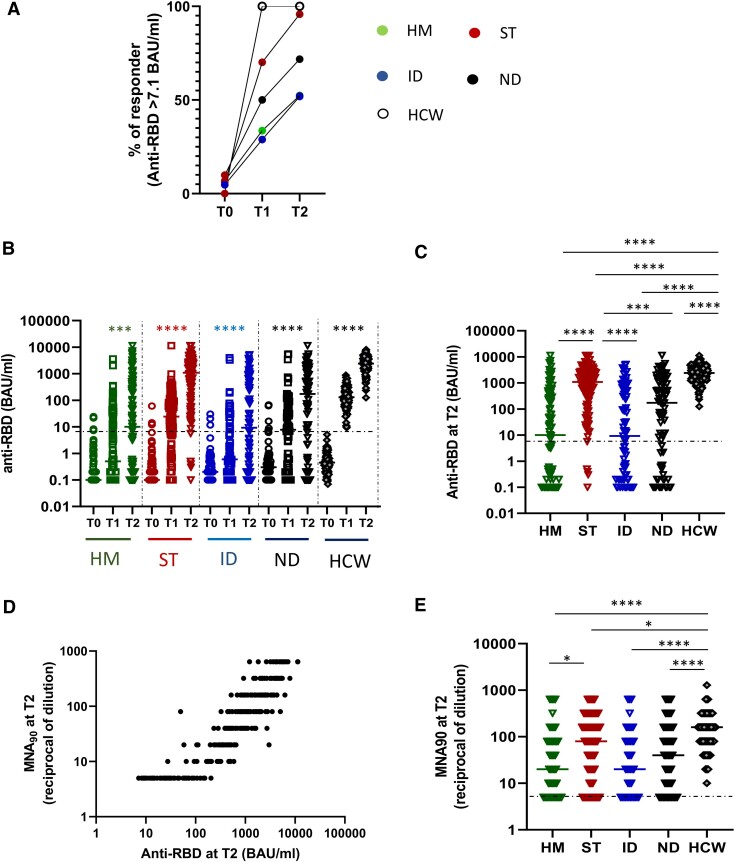
Figure 2.
Impact of different diseases on humoral response. A, The percentage of patients (HM, green dot; ST, red dots; ID, blue dots; ND, black dots; HCW, white dots) presenting a positive anti-RBD response (>7.1 BAU/mL) at each time point (T0, T1, and T2) is shown. B, Kinetics of humoral immune response before and after vaccination in HM (green dots), ST (red dots), ID (blue dots), ND (black dots), and HCW (gray dots). SARS-CoV-2 specific anti-RBD Abs were measured in sera samples at each time point. Anti-RBD-immunoglobulin G are expressed as BAU/mL and values >7.1 BAU/mL are considered positive. Differences were evaluated by Friedman paired test. ****P < .0001. C, The level of anti-RBD antibodies at T2 was compared among groups and was expressed as BAU/mL. Differences were evaluated by Kruskal-Wallis test. *P < .05; **P < .01; ***P < .001; ****P < .0001. HM: median = 10.0 BAU/mL (IQR 0.1–392.5 BAU/mL); ST: 1094.6 BAU/mL (IQR 265.1–2697.9 BAU/mL); ID: 9.2 BAU/mL (IQR 0.2–503.8 BAU/mL); NT: 172.9 BAU/mL (IQR 1.7–1457.8 BAU/mL) and HCW: 2405.0 BAU/mL (IQR 1343–3848 BAU/mL, respectively). D, The correlation between the levels of anti-RBD and neutralization titer at T2 for all fragile patients are shown. Each black dot represents one sample. Spearman test: rho = 0.9202, P < .0001. E, The levels of neutralizing antibody at T2 were quantified by microneutralization assay (MNA90) in all groups and were expressed as reciprocal of dilution. Differences were evaluated by Kruskal-Wallis test. *P < .05; ****P < .0001. HM: median = 20 reciprocal of dilution (IQR 5–80); ST: 80 reciprocal of dilution (IQR 20–240); ID: 20 reciprocal of dilution (IQR 5–80); NT: 40 reciprocal of dilution (IQR 8.75–160) and HCW: 160 (IQR 80–320). Abbreviations: Abs, antibodies; HCW, health care workers; HM, hematological malignancies; ID, immune-rheumatological diseases; IQR, interquartile range; ND, neurological disorders; RBD, receptor binding domain; SARS-CoV-2, severe acute respiratory syndrome 2 virus; ST, solid tumors; T0, before vaccination; T1, after 3–4 weeks from T0; T2, 5–8 weeks from T0.

