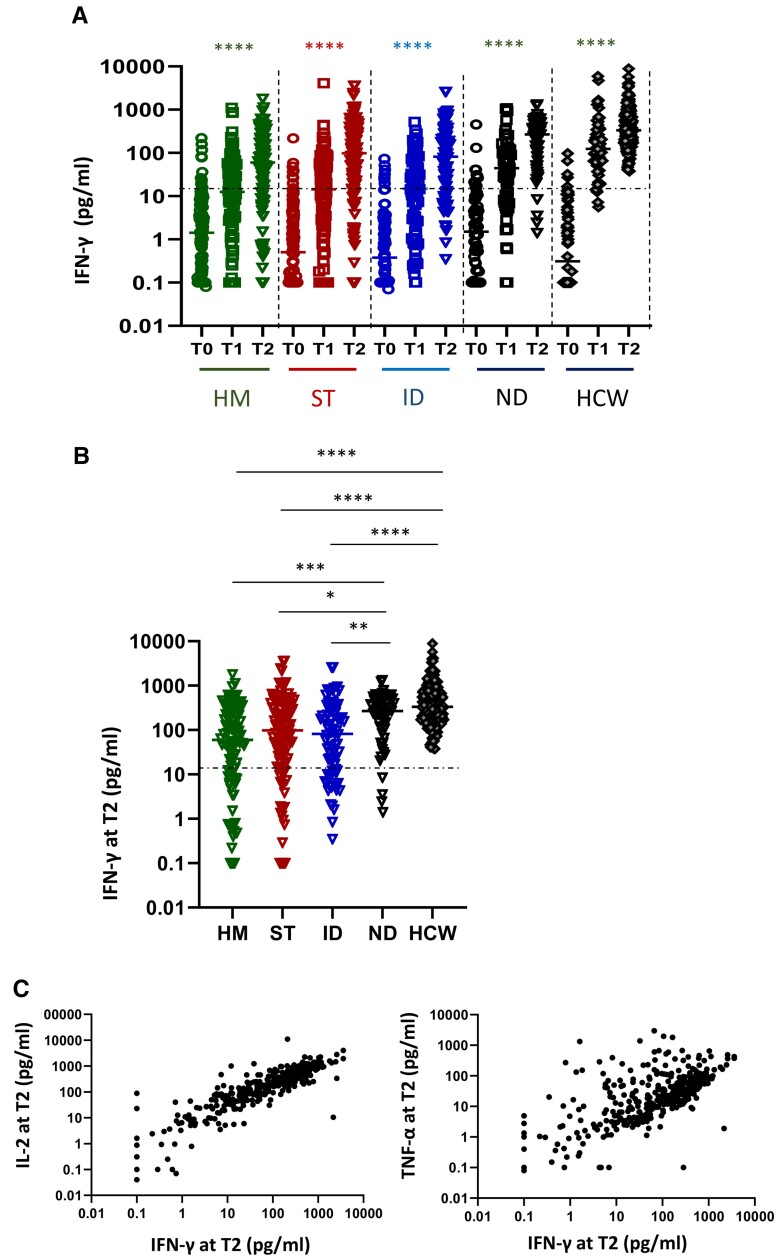
Figure 3.
Impact of different diseases on T-cell response. A, Kinetic of T-cell response before and after vaccination in HM (green dots), ST (red dots), ID (blue dots), ND (black dots), and HCW (gray dots). Spike-specific T-cell response was measured after stimulation of whole blood with specific peptides at each time point. T-cell response was expressed as pg/mL of IFN-γ and values >12 pg/mL are considered positive. Differences were evaluated by Friedman paired test. ****P < .0001. B, The level of T cell response at T2 was compared among groups and was expressed as pg/mL of IFN-γ. Differences were evaluated by Kruskal-Wallis test. *P < .05; **P < .01; ***P < .001; ****P < .0001. HM: median = 60.2 pg/mL (IQR 9.4–247.2 pg/mL); ST: 98.6 pg/mL (IQR 18.9–335.1 pg/mL); ID: 81.8 pg/mL (IQR 12.1–284.1 pg/mL); NT: 268.5 pg/mL (IQR 107.6–505.5 pg/mL) and HCW: 331.9 pg/mL (IQR 189.9–765.0 pg/mL, respectively). C: The correlation between the levels of IFN-γ and interleukin-2 or IFN-γ and tumor necrosis factor-α at T2 for all fragile patients are shown. Each black dot represents one sample. Spearman test: rho = 0.8739 and .6368, P < .0001. Abbreviations: HCW, health care workers; HM, hematological malignancies; ID, immune-rheumatological diseases; ND, neurological disorders; ST, solid tumors; T0, before vaccination; T1, after 3–4 weeks from T0; T2, 5–8 weeks from T0.

