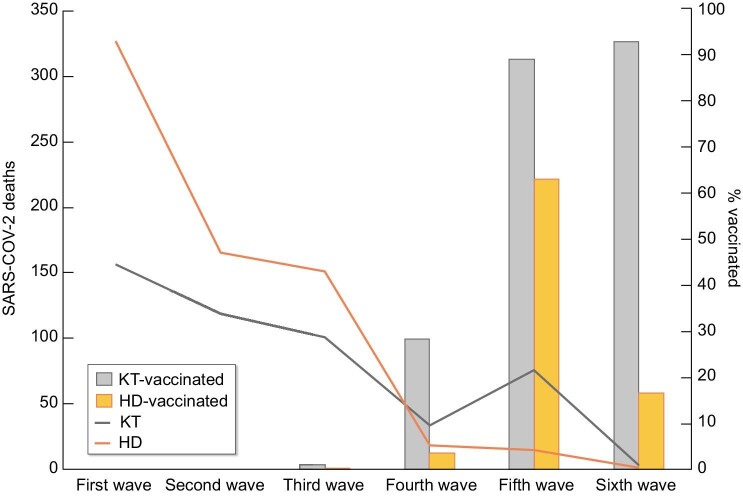
FIGURE 4:
SARS-CoV-2 deaths and vaccination status among kidney transplant recipients and haemodialysis patients. Continuous lines refer to total deaths in the different cohorts. Bars indicate the percentage of vaccination among patients dying from COVID-19. KT, kidney transplant; HD, haemodialysis.

