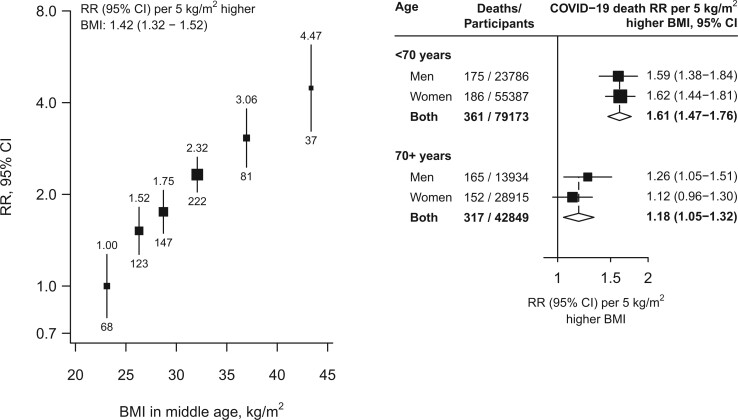
Figure 1.
Body mass index versus risk of death from COVID-19. In the left panel, estimates are adjusted for age, sex, education and district and in the right panel, the age- and sex-stratified results are adjusted for age, education and district. The areas of the squares are proportional to the amount of statistical information and the lines through them are the 95% confidence intervals. The numbers above each vertical line in the left panel show the death rate ratio for that group and the numbers below each vertical line give the number of COVID−19 deaths in that group. In the right panel, the diamonds are the information-weighted averages of the two results above them. BMI, body mass index; CI, confidence interval; RR, mortality rate ratio

