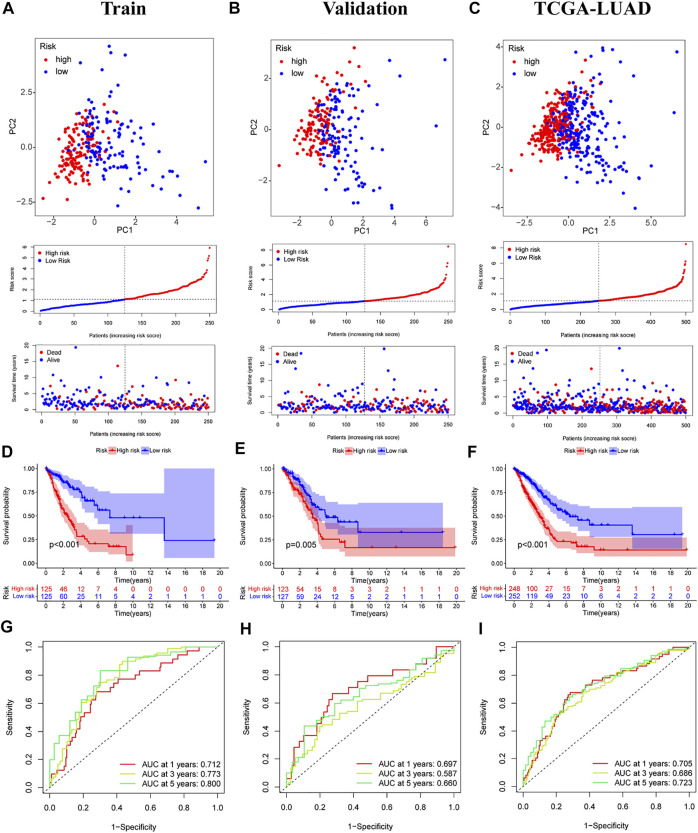
FIGURE 4.
Validation of prognostic models for six m7G-related lncRNAs. (A–C) Principal component analysis, risk score distribution, and survival status distribution for training, validation, and TCGA-LUAD. (D–F) Kaplan-Meier curves of training group, validation group and TCGA-LUAD at different risk groups. (G–I) ROC curves for 1 year, 3 years and 5 years.

