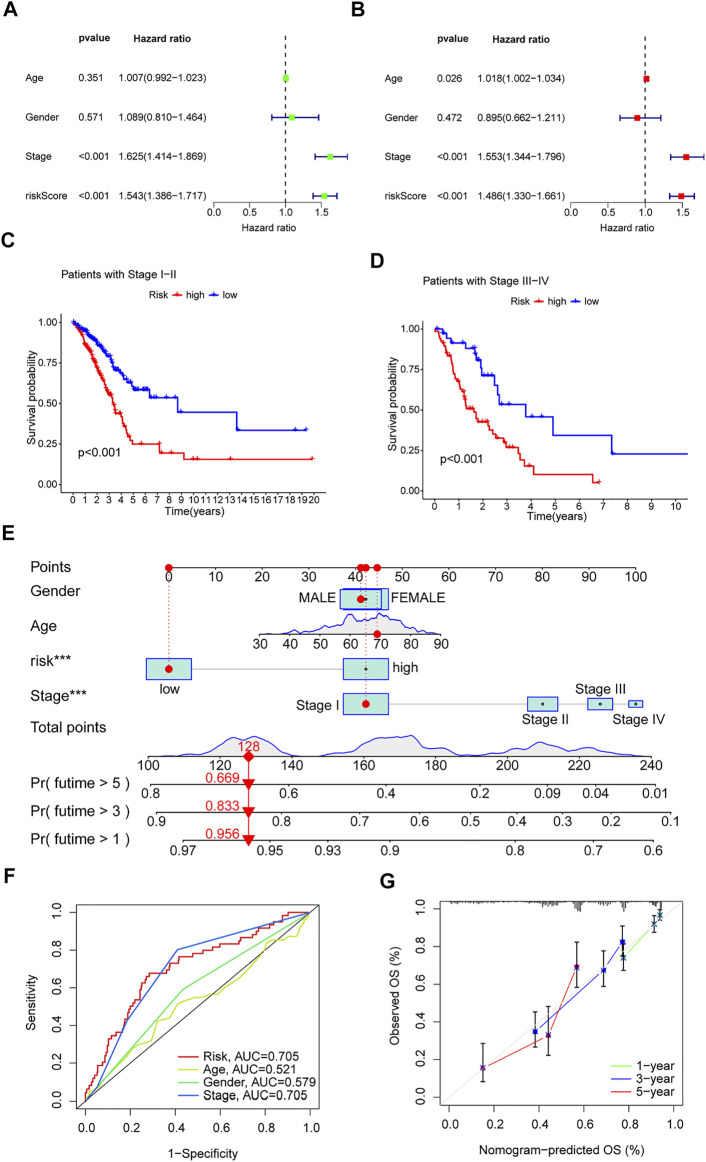
FIGURE 5.
Clinical value of risk characteristics in TCGA-LUAD. (A) Univariate Cox regression analysis of risk scores and clinical factors. (B) Multivariate Cox regression analysis of risk scores and clinical factors. (C,D) Pathological stage was stratified between low- and high-risk groups in the entire collection. (E) Nomogram combining gender, age, stage, and risk score predicts 1-, 3-, and 5-years overall survival. (F) Clinicopathological features and the predictive accuracy of risk models. (G) Calibration curves test the agreement between actual and predicted results at 1, 3, and 5 years. *p < 0.05, **p < 0.01, ***p < 0.001.

