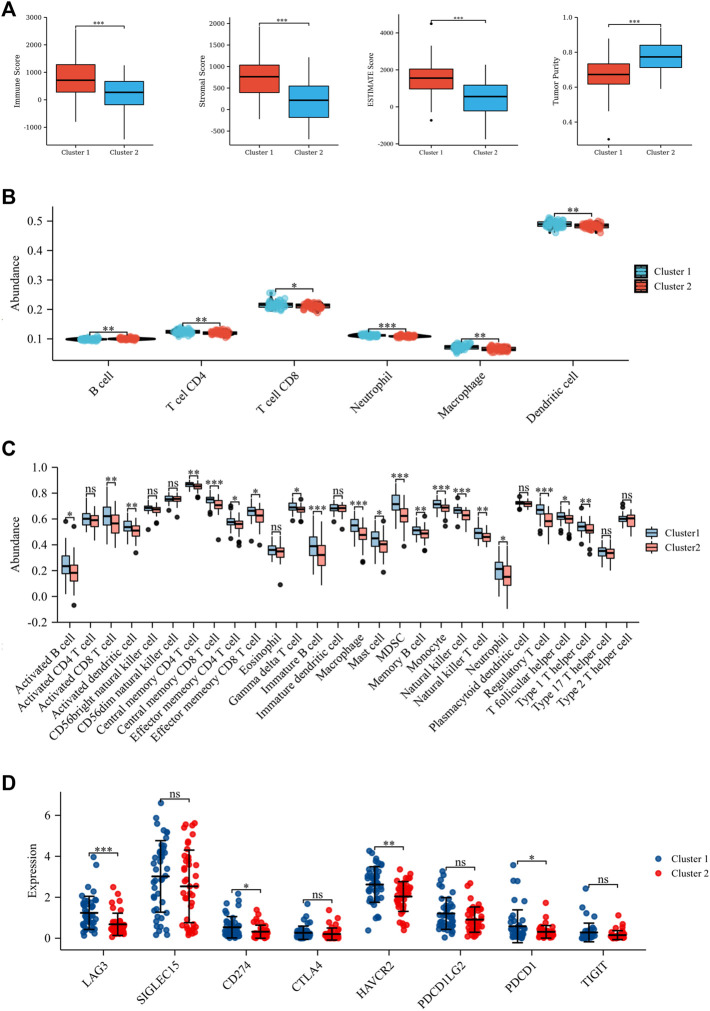
FIGURE 2.
Tumor microenvironment in the two subtypes. (A) Stromal score, immune score, ESTIMATE score, and tumor purity based on ESTIMATE algorithm. (B) Six immune cell abundance assessments by the TIMER algorithm. (C) Twenty-nine immune cell abundance assessments by the ssGSEA algorithm. (D) Differences in immune checkpoints between the two subtypes. *p < 0.05; **p < 0.01; ***p < 0.001.

