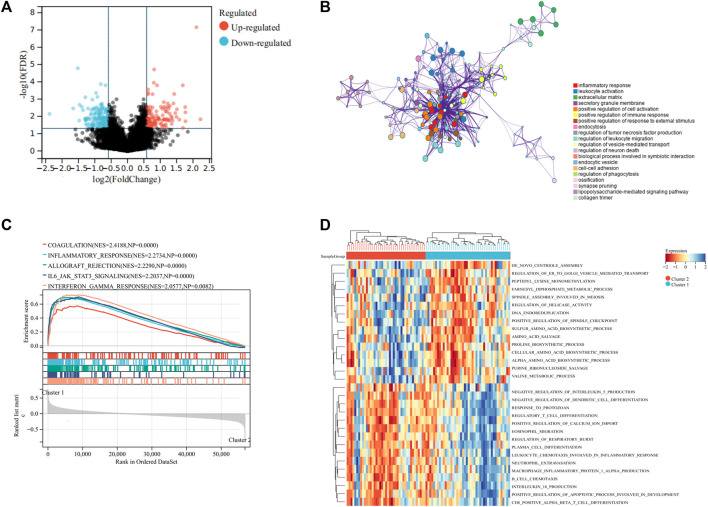
FIGURE 3.
Differentially expressed genes and functional enrichment analyses. (A) Volcano plot showing the DEGs between the two subgroups. (B) Bubble plot exhibited the functional enrichment of DEGs through GO analysis. (C) GSEA shows the hallmark gene sets in the two subgroups. (D) Heat map depicted the results of the GSVA analysis.

