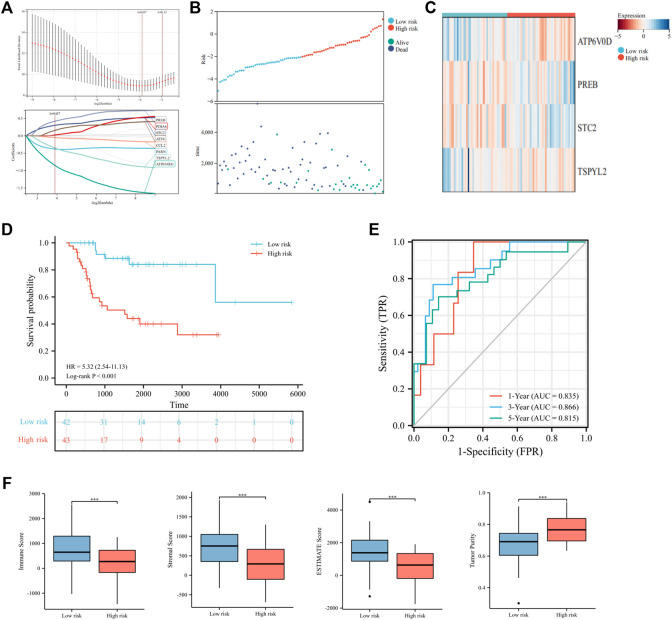
FIGURE 4.
Construction of the risk signature based on UPRRGs in the training cohort. (A) Eight optimal UPRRGs filtered by LASSO analysis. (B) Distribution of risk scores and patient status in the two risk groups; (C). Heat map showing the expressions of four candidate genes. (D) Survival curves for the two risk groups. (E) Time-dependent ROC curve of the risk model. (F) Tumor microenvironment analysis in the two risk groups through the ESTIMATE algorithm. *p < 0.05; **p < 0.01; ***p < 0.001.

