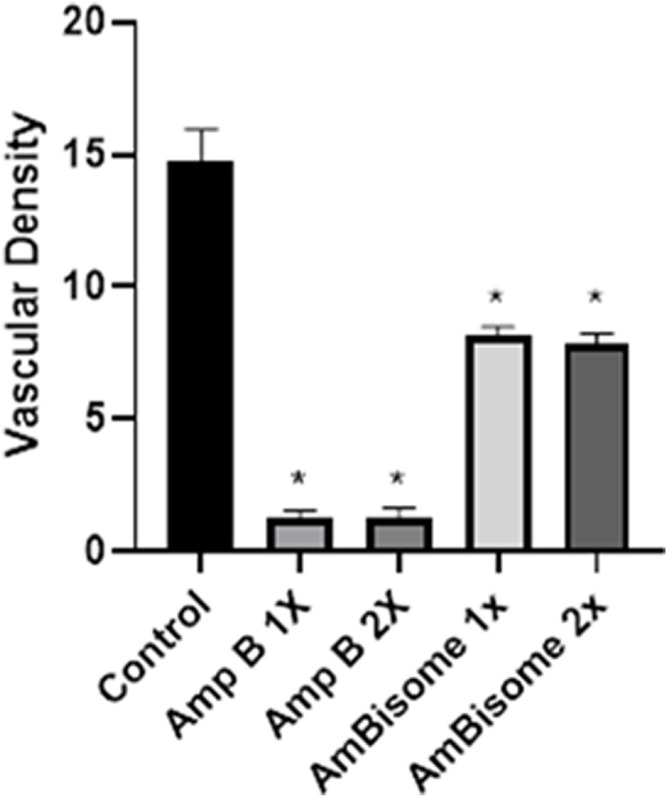
FIGURE 6.

Vascular density following Amphotericin B and AmBisome. Control group, Amp B 1x and 2x, and L-Amp1 X and 2X, respectively. A significant reduction in vascular density is seen in both groups that received Amp B and AmBisome. The embryos that received the Amp B exhibited less vascular density than AmBisome (error bars show mean standard error; *p < 0.05 compared control group).
